omp0 - a minimal OpenMP runtime, implemented from scratch on pthreads, evaluated against GCC's libgomp.
Sreeram (svennam), Bhargav (bkommire)
omp0 is a from-scratch OpenMP runtime:
parallel, parallel for (static / dynamic
/ guided), critical (5 spinlocks + pthread_mutex + a
custom futex lock), 2 barriers (sense, tree), and 2 reductions
(linear, tree). Every primitive is behind an interface, swapped
via one RuntimeConfig field. Benchmarks: Pi, 256x256
matmul, 512x512 Mandelbrot. Platforms: GHC Coffee Lake (8 cores)
and PSC Bridges-2 EPYC 7742 (128 cores). Compared to libgomp.
Instrumented with hardware perf counters. 63 unit tests pass.
Headline result: the best lock depends on platform; the
"spinlocks beat mutexes for short critical sections" rule
inverts between GHC and PSC.
OpenMP is fork-join shared-memory.
#pragma omp parallel forks a team that runs the
region concurrently, joins at the end. A persistent thread
pool avoids paying pthread_create on every
region. Inside a region, three classes of primitives:
Loops. Static schedules pre-compute
[i·N/P, (i+1)·N/P) per thread ;
no runtime cost, bad if iterations vary. Dynamic uses a shared
fetch_add counter to claim chunks. Guided is dynamic
with shrinking chunks.
Locks. TAS spins via atomic exchange: every spin
is a write, so contention causes an invalidation storm. TTAS
spins on a cached read, only writes to acquire. Ticket adds FIFO:
fetch_add(&next_ticket), wait for
now_serving to match. MCS uses a per-thread queue
node: spin on your own line, release writes only the successor's.
Barriers. Sense-reversing: shared counter + sense flag, last arriver flips the flag. Tree: binary tree of arrivals, O(log P) depth.
Reductions. Linear: each thread writes a partial, master combines in P sequential ops. Tree: ⌈log2 P⌉ phases of pairwise combines with a barrier between each.
What's parallelized. A
#pragma omp parallel region is the unit of work.
Entering it wakes the pool; all P threads run the body
concurrently with different tids; exiting puts
workers back to sleep. parallel_for additionally
splits loop iterations via the scheduler. Everything outside the
region runs only on master. Our app kernels:
Pi (independent per-thread RNG), matmul (one row per thread),
Mandelbrot (per-pixel iteration with very uneven termination).
Runtime's job is cheap region entry/exit, cheap work assignment,
and cheap sync.
Locality and SIMD. Apps have natural locality (contiguous output slices). No SIMD beyond what the compiler infers; vectorization is orthogonal. The sync primitives have rich locality behavior (which line bounces, which stays in S, which thread spins where). That's our HW-counter focus.
Stack. C++20 + pthreads, ~2500 lines, CMake. Targets: GHC Coffee Lake (8c/16t) and PSC Bridges-2 EPYC 7742 (128 cores, dual socket).
Architecture. Abstract interfaces
(Lock, Barrier, Scheduler)
+ a single RuntimeConfig for selection:
omp0::RuntimeConfig cfg;
cfg.num_threads = 4;
cfg.lock        = omp0::LockKind::MCS;
cfg.barrier     = omp0::BarrierKind::Tree;
cfg.sched       = omp0::SchedKind::Dynamic;
cfg.reduce      = omp0::ReduceKind::Tree;
cfg.pin_threads = true;
omp0::Runtime rt(cfg);

int sum = rt.reduce<int>(0,
    [&](int tid, int){ return work(tid); },
    [](int a, int b){ return a + b; });
The Runtime owns a persistent ThreadPool.
parallel() dispatches: master is tid 0,
workers are tid 1..N-1.
parallel_for builds a scheduler and each thread
calls next(). critical wraps a call
with the configured lock. reduce joins partials
via linear or tree.
Mapping to hardware. Workers are pthreads.
pin_threads = true binds worker i to
core i mod nproc. Lock/barrier state is
alignas(64) to avoid false sharing. MCS's queue
node is thread_local: spinning happens on memory
only the owner reads, only the predecessor writes. Each thread
opens its own perf_event_open fd; harnesses sum
counters after join.
Bench infrastructure. Six independent CMake targets, one CSV each:
| target | what it measures |
|---|---|
omp0_bench | apps (pi, matmul, mandelbrot) × 3 schedulers × {pinned, unpinned} × threads 1..hw |
gomp_bench | same apps, libgomp reference (compiled with -fopenmp) |
lock_bench | 6 lock variants × 4 critical-section lengths {0, 100ns, 1us, 10us} × threads 1..hw, with HW counters |
barrier_bench | 2 barrier variants × threads 1..hw, with HW counters |
reduction_bench | linear vs tree combine × threads 1..hw, with HW counters |
oversub_bench | locks at thread counts past hw_concurrency (1, 2, 4, 8, 16, 32, 128) |
plot.py dispatches on which benchmark
rows are present. scripts/run_all.sh orchestrates,
with skip flags (SKIP_OVERSUB, SKIP_GOMP,
OMP0_MAX_THREADS, etc.) for partial sweeps.
Three bugs worth recording.
Tree reduction needs a barrier between strides. We tried, in order:
SenseBarrier. Uses
static thread_local int local_sense_. Works
for one barrier instance, breaks across multiple
Runtime instances on the same thread:
local_sense_ persists, fresh workers see the
initial value, protocol desyncs.std::barrier. Fixed the
desync but deadlocks on libstdc++ under heavy reuse.pthread_barrier_t.
Final answer. Constructed fresh per reduction call. No
thread-local state, no reuse races.
perf_event_open looks unified across vendors but
leaks in three places: counter count, scheduling rules, and
event-name mappings.
(1) Counter count. Coffee Lake: 8 GP PMCs +
3 fixed (cycles, instructions, ref_cycles). Zen 2: 6 GP, no
fixed. Our first wrapper opened 8 events (cycles, instructions,
L1d read/write miss, LLC miss, cache refs, bus cycles, branch
miss) as one perf group with PERF_FORMAT_GROUP for
atomic reads. Works on Intel. On AMD, 8 grouped events don't
fit in 6 PMCs, and grouped events can't multiplex, so the
kernel never schedules the group. Each
perf_event_open succeeds,
available() returns true, every read
returns 0. First AMD run: a CSV of zeros that looked like
missing data, not a bug.
(2) Multiplexing + time scaling. Drop
PERF_FORMAT_GROUP; open each event independently
with
PERF_FORMAT_TOTAL_TIME_ENABLED | TIME_RUNNING.
Kernel multiplexes events across PMCs. Each read returns
{value, time_enabled, time_running}. Scale by
time_enabled / time_running:
struct { uint64_t value, time_enabled, time_running; } data{};
read(fds_[i], &data, sizeof(data));

uint64_t scaled = data.value;
if (data.time_running > 0 && data.time_running < data.time_enabled) {
    double r = (double)data.time_enabled / (double)data.time_running;
    scaled = (uint64_t)((double)data.value * r);
}
Tradeoff: lose cross-event atomicity. Fine for benches that integrate over hundreds of ms.
(3) Bad event mappings. Two abstracted events don't map cleanly:
PERF_COUNT_HW_BUS_CYCLES: designed for
the Pentium FSB. Modern Intel/AMD use point-to-point
interconnects (UPI, Infinity Fabric). Returns garbage.
Dropped from plots.PERF_COUNT_HW_CACHE_L1D | OP_WRITE | RESULT_MISS:
no clean native mapping on either CPU. Closest:
Intel L2_RQSTS.RFO_HIT/MISS, AMD
L1_DC_REFILLS (different semantics).
Kernel returns 0. The L1d-misses-stacked plot is read-only
as a result.
(4) Graceful degradation. Each event opens
independently; a failed perf_event_open just
skips that event. PSC needs sbatch -C PERF for
PMU access; without it every read is −EACCES. Without
graceful degradation, the whole sweep would die on the wrong
partition. Wrapper lives at src/perf/counters.cpp.
Same binary, same C++, but counter count, scheduling, and
event semantics all differ; a naive
perf_event_open works on one CPU and silently
lies on the other.
Original design: shared active_ counter, master
sets it to N-1, workers fetch_sub,
last worker notifies cv_done_. Worked on Coffee
Lake for millions of rounds. Deadlocked on EPYC 7742 around
round 80–100 of the reduction bench.
Bug: a slow worker's fetch_sub for round K
could land after master had already started round
K+1 and reset active_ to N−1.
The late decrement now lands in round K+1's counter
; off-by-one forever. Intel's TSO hides this because the
worker's gap between fetch_sub and re-entering
cv_work_.wait is microscopic. Zen 2's cross-CCX
latency stretches it enough to fire ~1% of transitions;
cumulative deadlock probability hits 50% around round 70.
Fix: per-generation completion slots
worker_finished_count_[gen & 1].
Each worker increments its own round's slot. Master spins
(with this_thread::yield) on the slot for the
round it kicked off. my_gen is captured under
the lock and monotonic per worker, so completions can't
cross rounds.
Three sections: GHC (Coffee Lake, 8 cores) for
small-scale per-primitive analysis;
PSC (EPYC 7742, 128 cores, dual socket)
for high-thread-count behavior;
cross-machine for the results that need both.
Data points are median or mean ± σ of 3–5
samples; warmup runs discarded. HW counters per-thread, summed
after join. Both platforms run the same binaries
(-O3 -march=native).
Intel Coffee Lake-S, 8c/16t, single socket, single L3. HW counters fully available. Development platform.
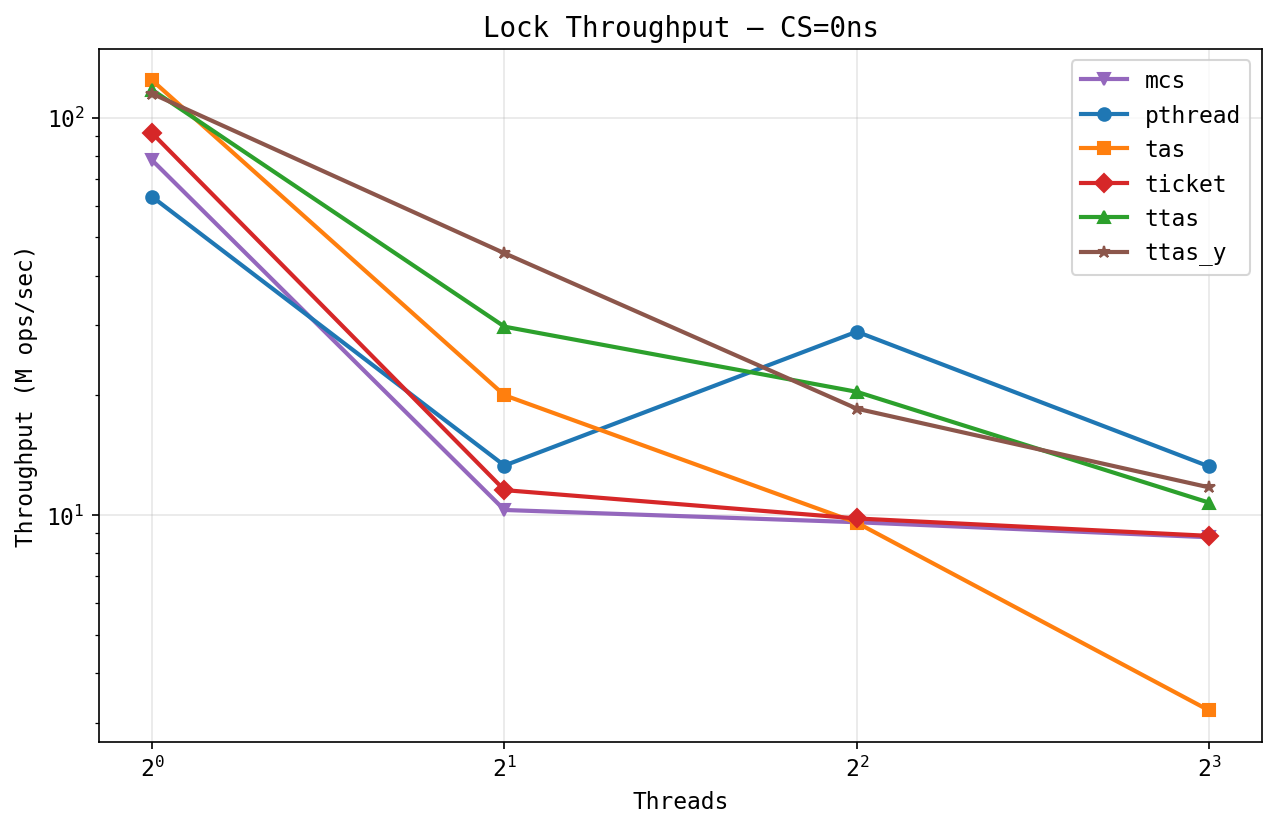
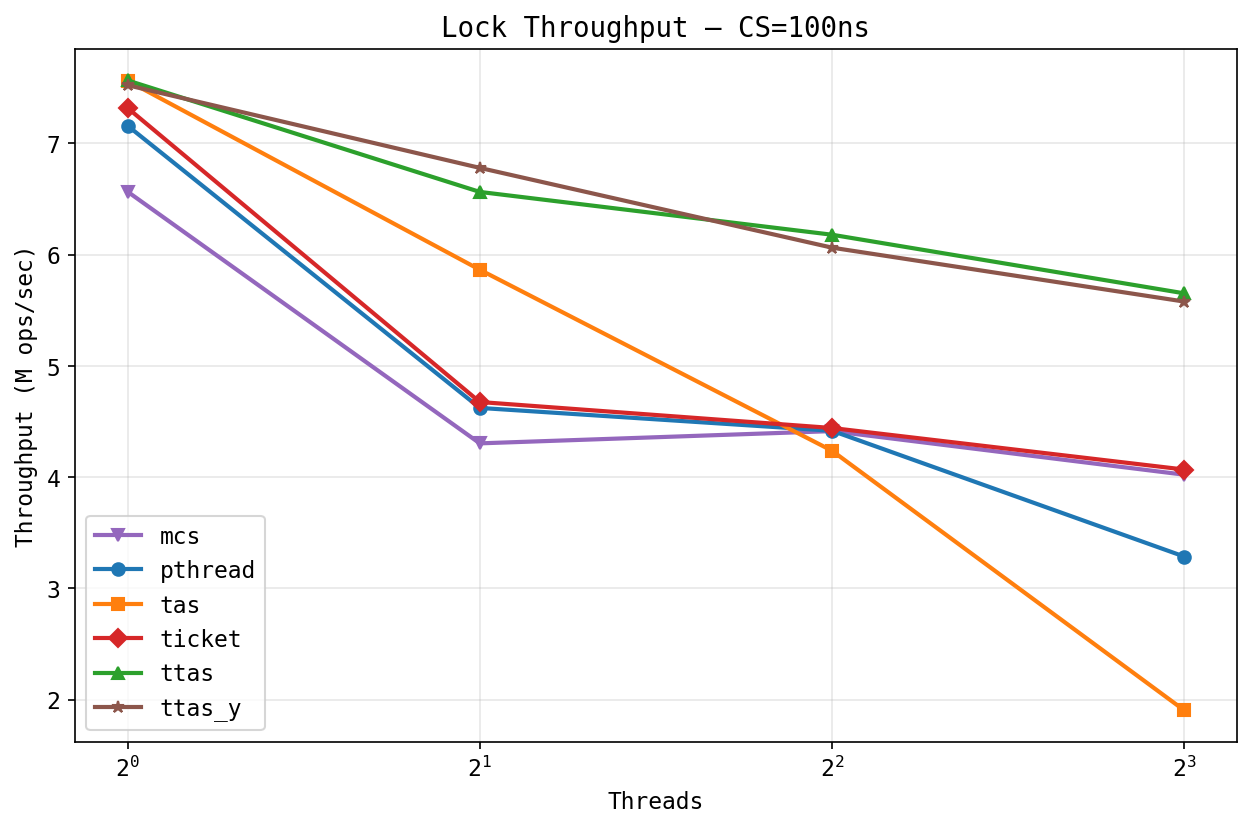
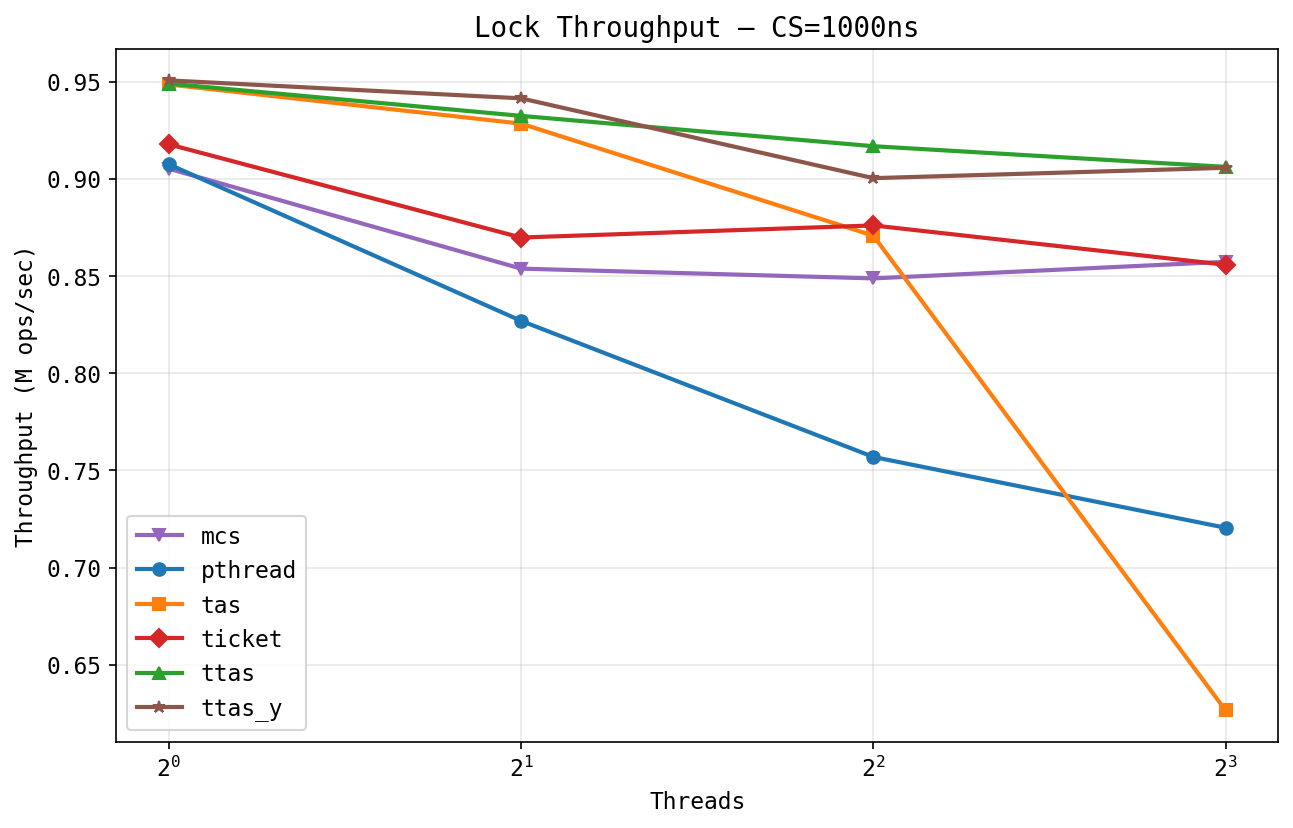
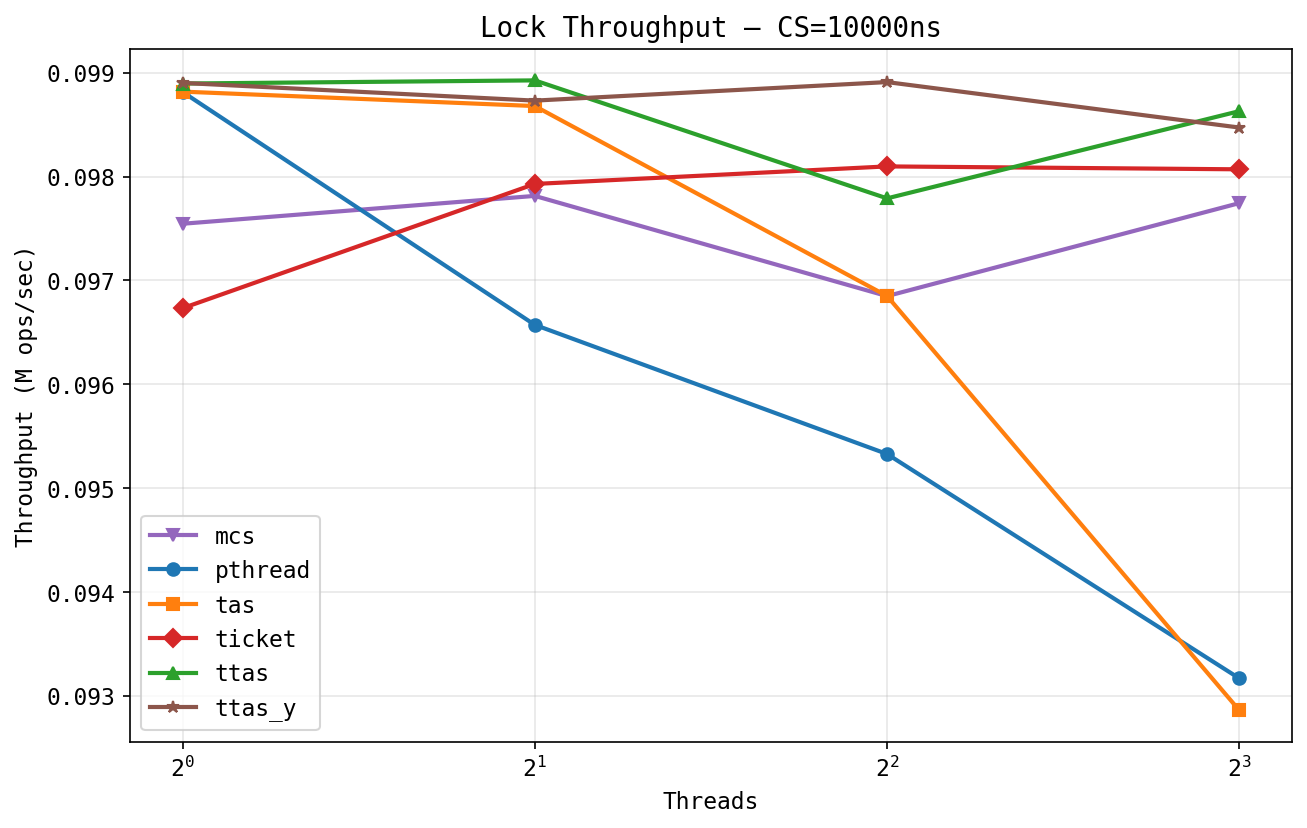
Throughput vs threads, by CS length. Four CS values: 0, 100 ns, 1 µs, 10 µs. Y-axis is log when the spread >5×.
Three regimes:
MESI / cache traffic, all at cs=0. Top-left: total L1d misses. Top-right: L1d miss rate per cycle. Bottom: LLC misses and rate.
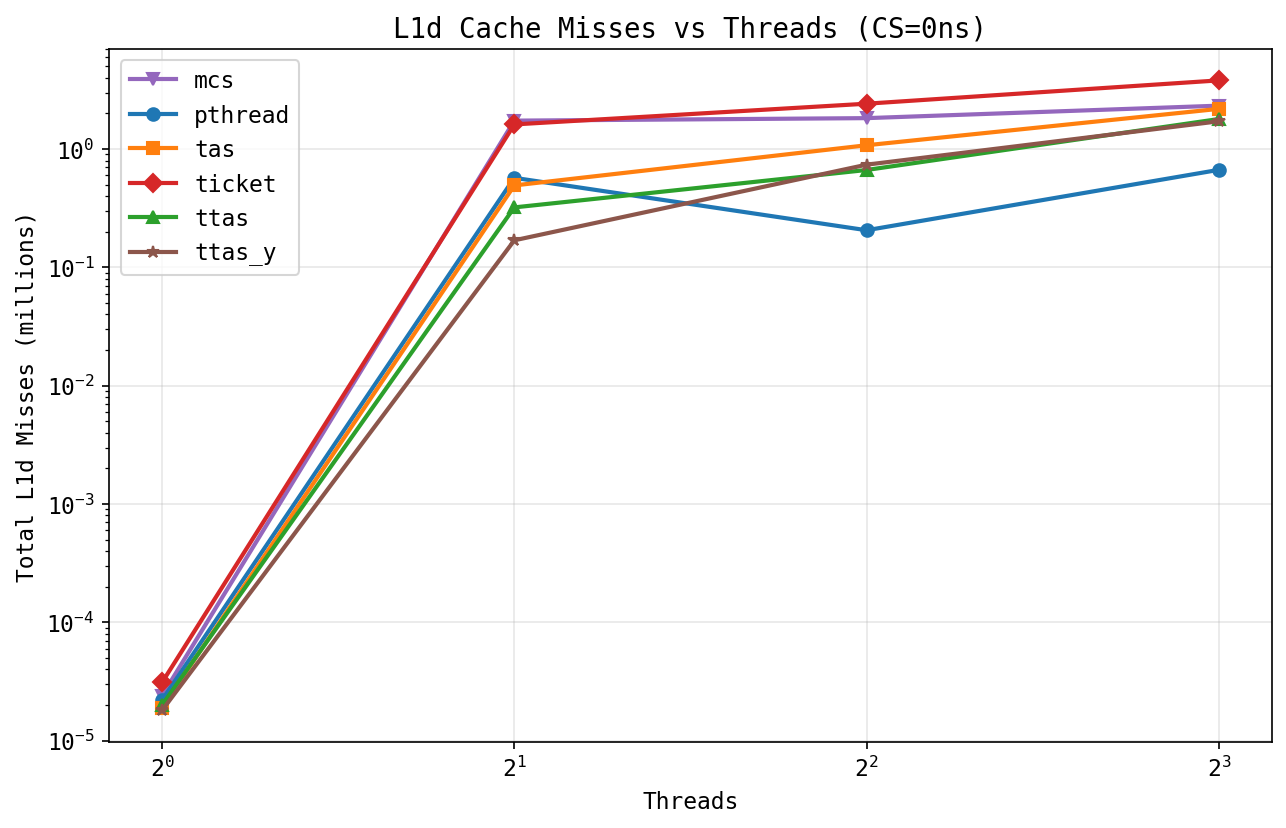
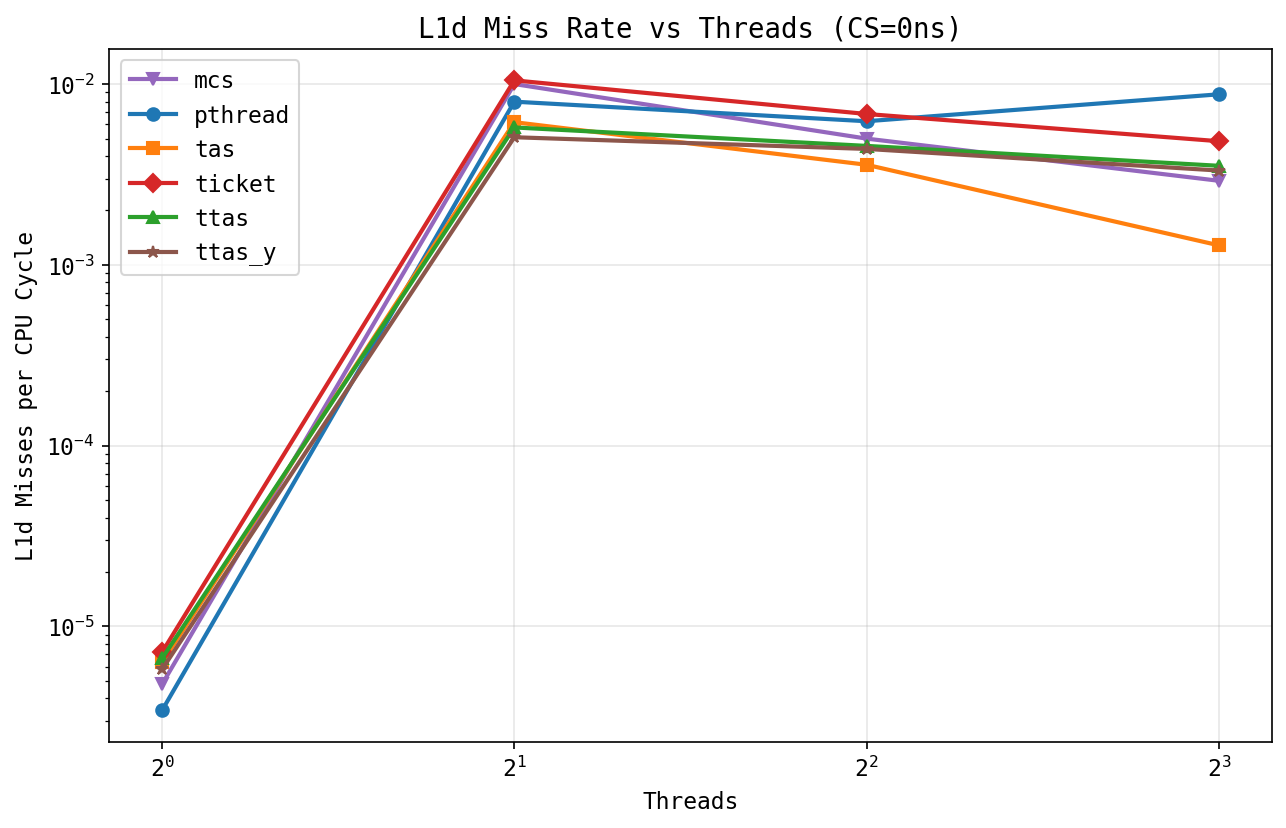
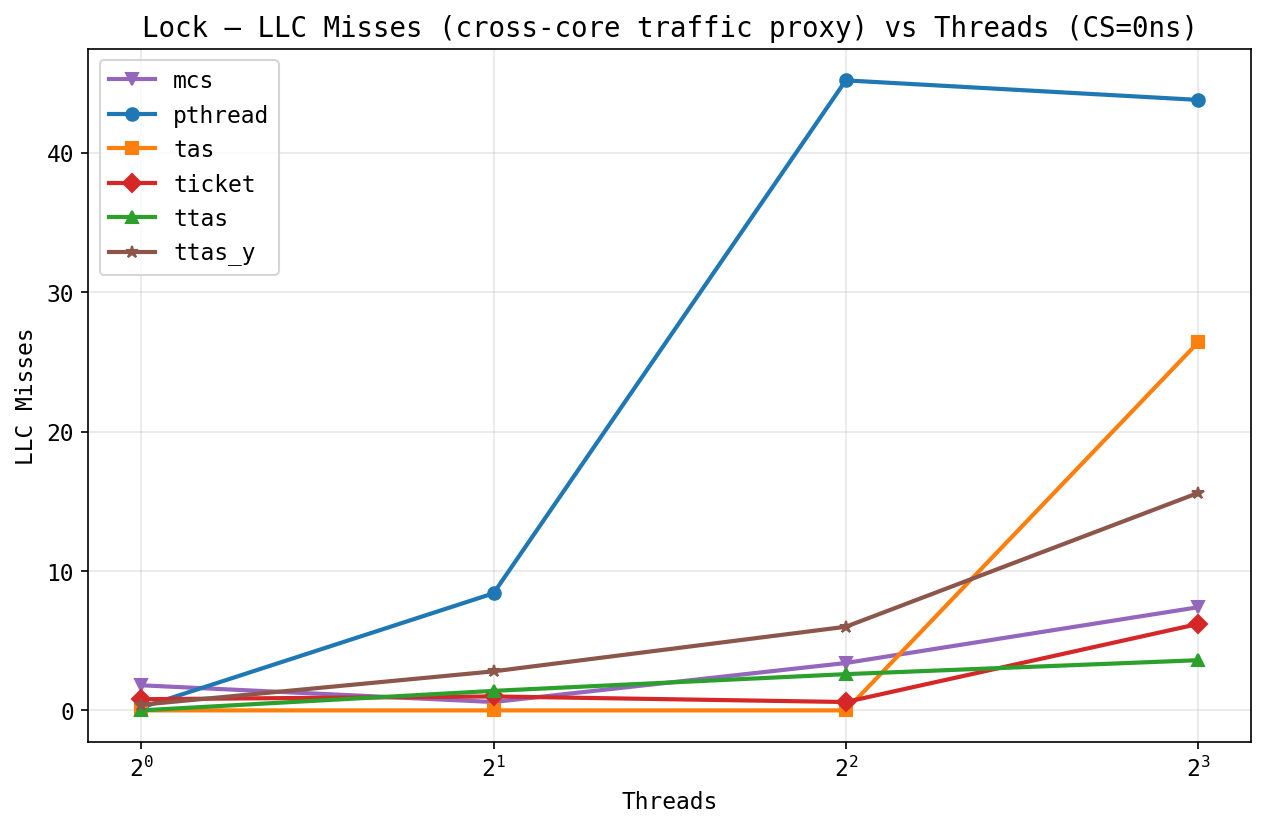
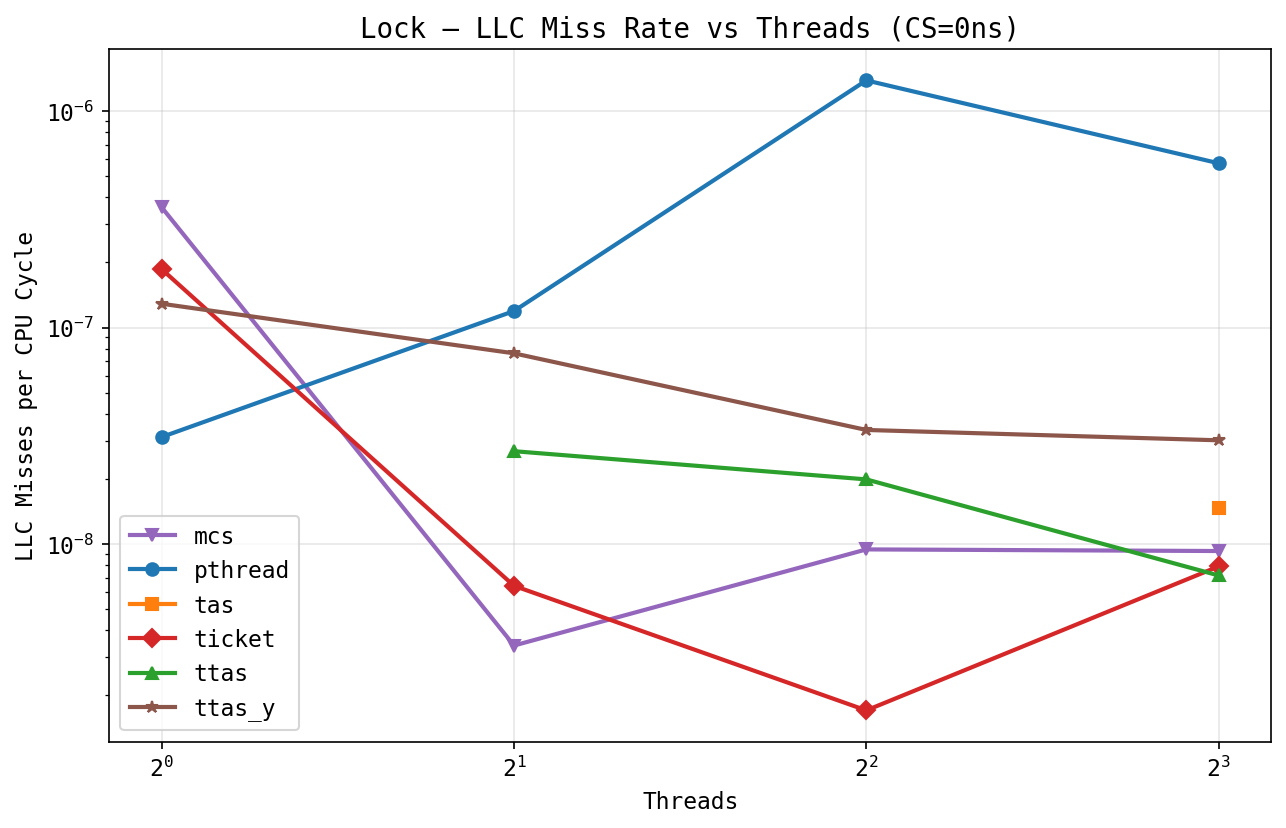
At 16 threads: TAS / ticket ~5.5 M L1d misses, MCS ~4 M, TTAS ~2.9 M, pthread ~1 M (sleeps, never touches userspace memory). Per-cycle rate flips it: ticket / MCS are lowest (private L1-resident spin); pthread is highest (few active cycles, all near cache-cold futex transitions). LLC: TAS / ticket scale with threads (line-bouncing); MCS and TTAS stay flat (private lines); pthread near zero.
Cycle accounting + IPC.
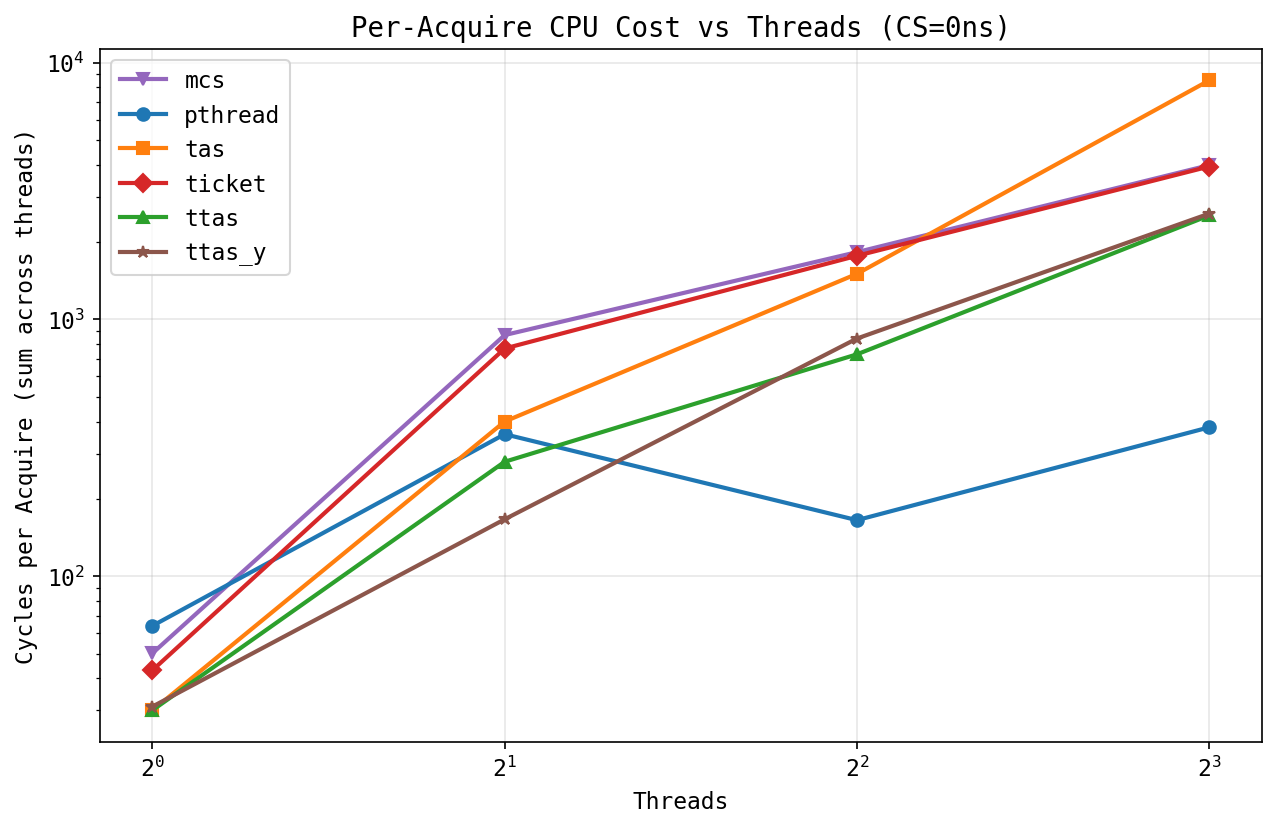
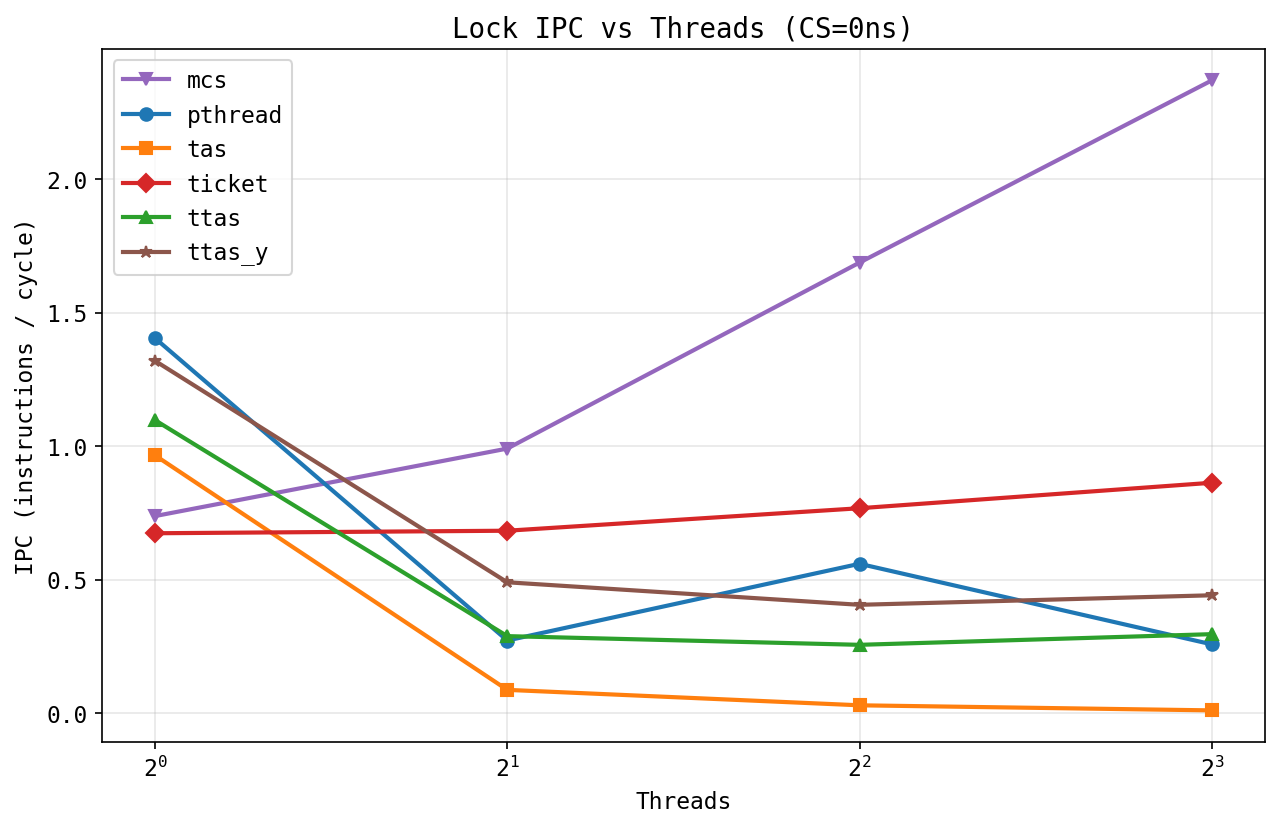
Pthread: flat ~250 cycles (sleeps, doesn't burn cycles
spinning). TAS rises fastest (every spin = stalled
LOCK XCHG). Ticket / MCS rise sharply near
hw_concurrency; FIFO + preemption stalls the whole queue
behind a descheduled holder. IPC at 16 threads: TAS ~0.01
(spin-stalled); MCS / ticket 3+ (L1-resident spin, dense but
useless). High IPC ≠ making progress.
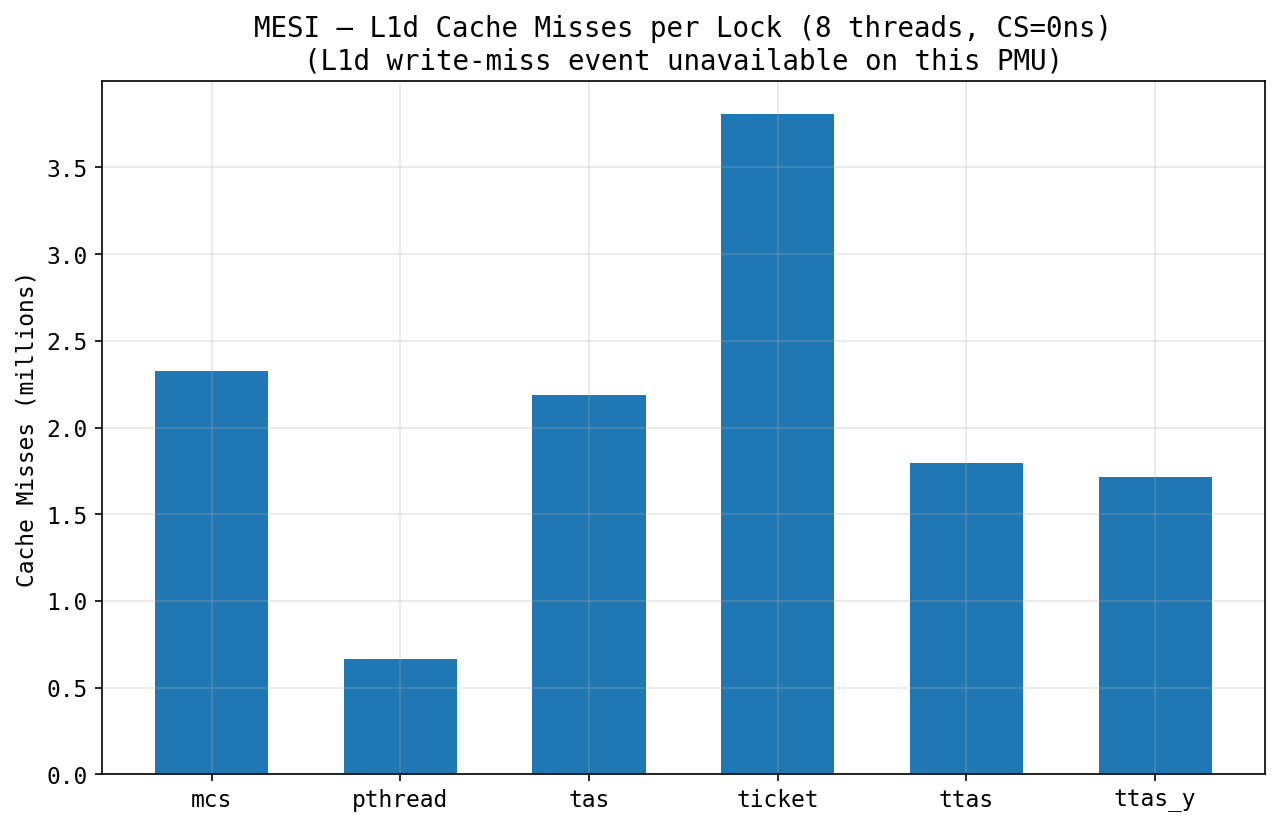
L1d read misses at 16 threads. (Wanted read+write breakdown but
PERF_COUNT_HW_CACHE_L1D|OP_WRITE|RESULT_MISS
returns 0 on both CPUs; see the perf-counters section.)
Ticket dominates: every waiter re-reads now_serving
after each release. TAS is close behind: every spin is an RMW.
MCS is quiet: waiters read their own private node, only
invalidated by the predecessor's release write. pthread is
quietest: blocked threads aren't running.
Oversubscription (threads > nproc): FIFO locks pay for fairness.
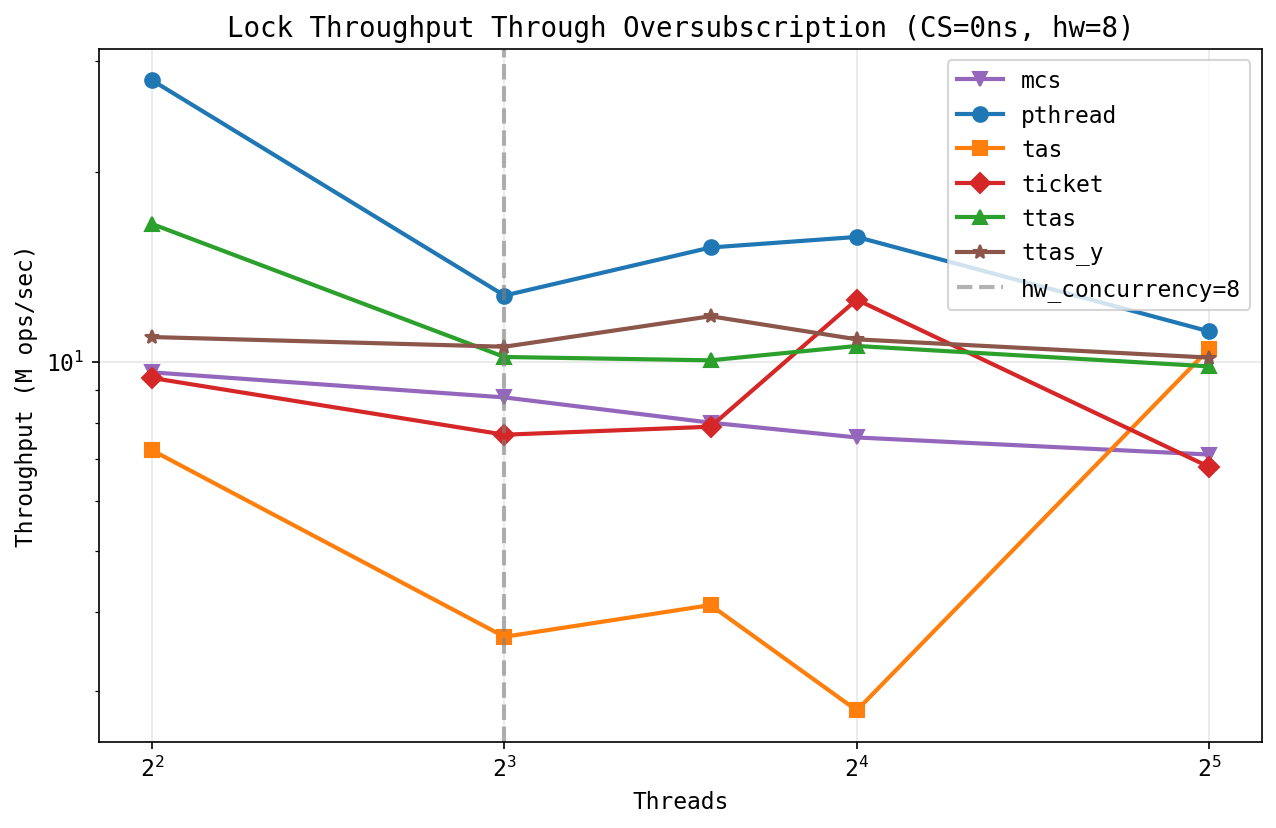
Sweep nproc/2 to 16× nproc, cs=0. MCS and ticket collapse at threads = nproc; under 100 K ops/sec, orders of magnitude worse than the rest. FIFO + preemption: descheduled holder = stalled queue. Non-FIFO spinlocks handle oversubscription fine because any free observation can win the race.
Pthread wins at high thread counts, spinlocks win at low ones.
Question: how much of pthread's win is the futex/blocking
idea vs glibc's specific implementation? We
wrote FutexLock (src/sync/futex_lock.cpp)
to find out: a 50-line three-state futex mutex, no libpthread.
State ∈ {0=unlocked, 1=locked, 2=locked-with-waiters}.
Fast path: one CAS 0→1. Slow path: spin 64 ×
pause, then FUTEX_WAIT_PRIVATE.
Release: fetch_sub, and
FUTEX_WAKE_PRIVATE only if there were waiters.
Compared against pthread_mutex on both GHC and PSC.
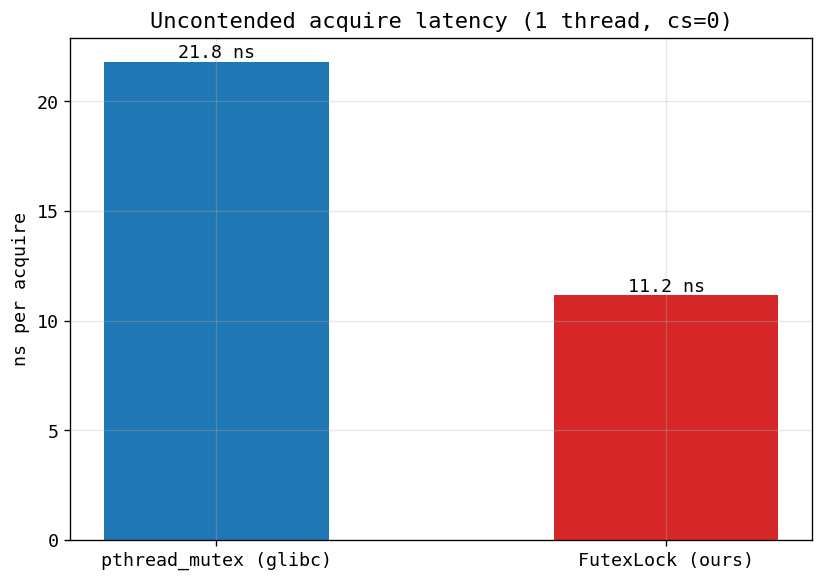
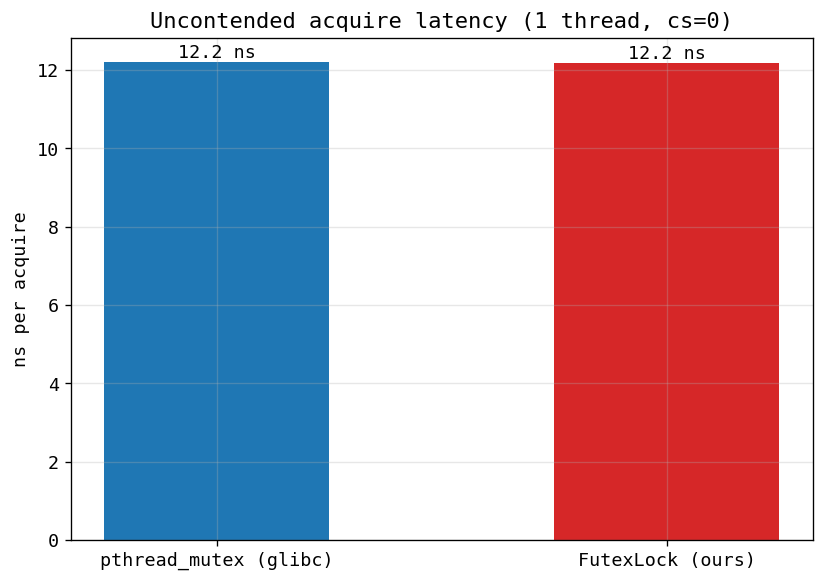
Uncontended fast path is platform-dependent. GHC (older glibc): FutexLock 11.2 ns vs pthread 21.8 ns ; we beat pthread ~2×. The gap is glibc's libgcc indirection and per-entry kind/robustness/recursion checks; the futex primitive itself is identical. PSC (newer glibc): both at 12.2 ns. PSC's glibc has trimmed that overhead. So "we beat pthread 2×" only holds on GHC.
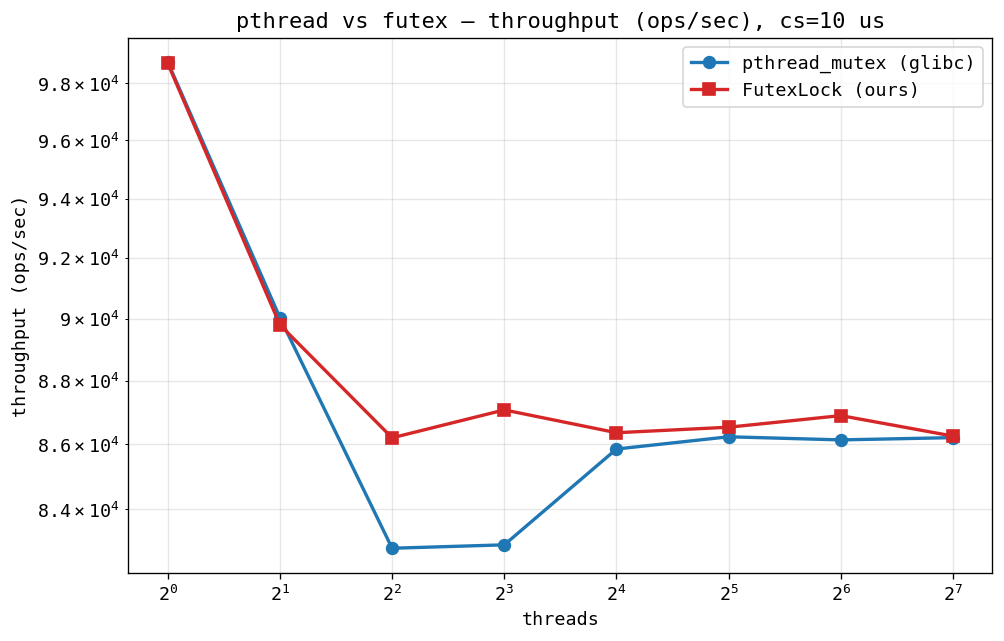
Throughput, GHC, four CS values.
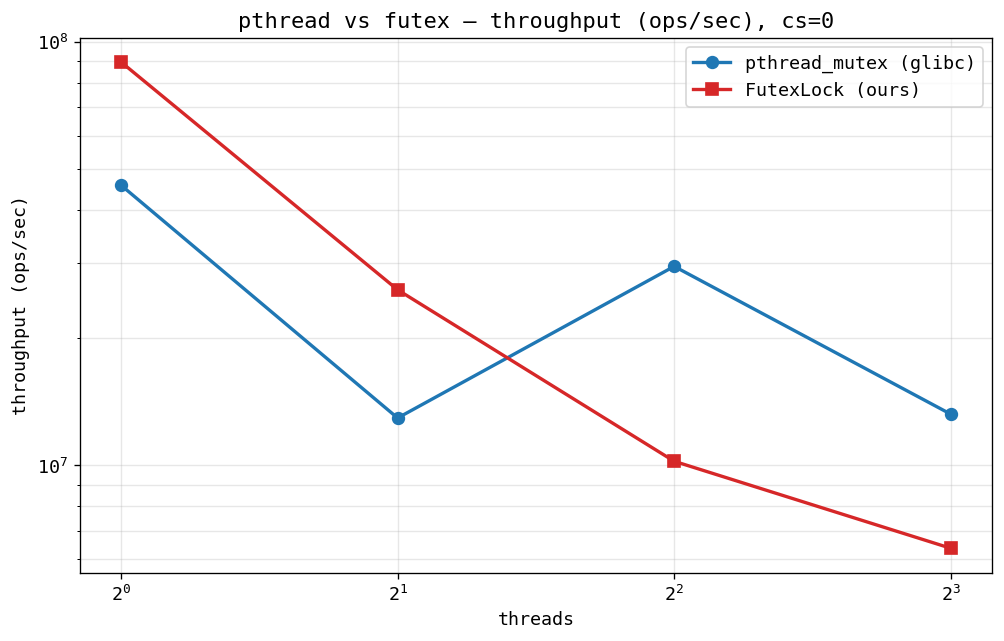
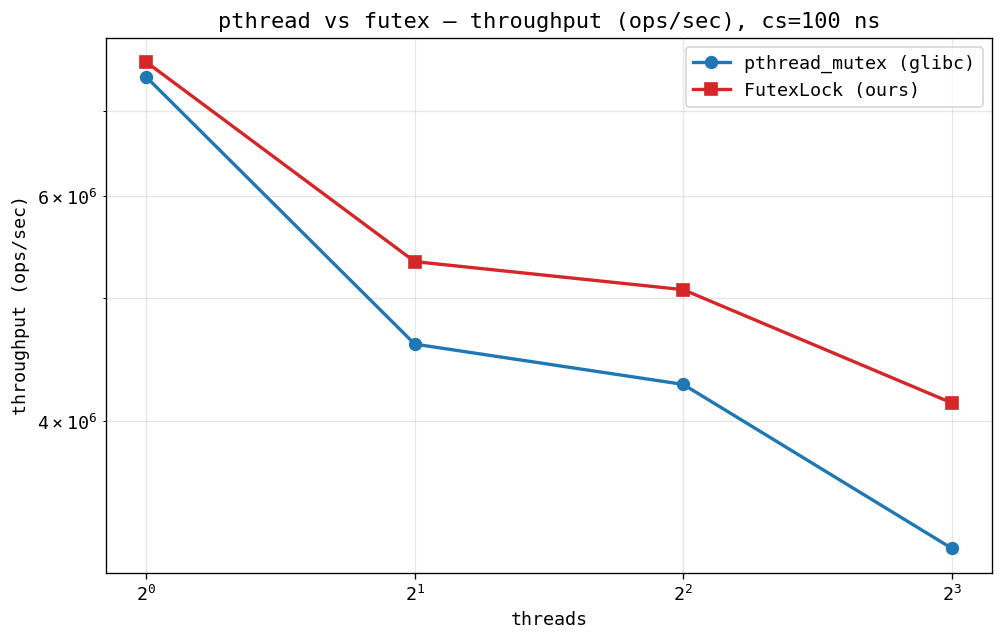
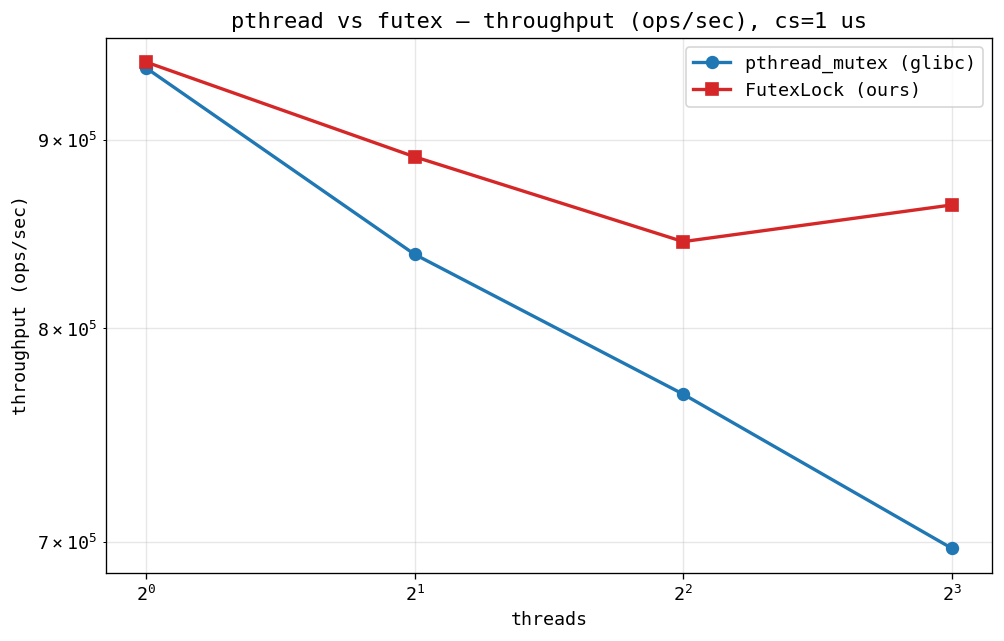
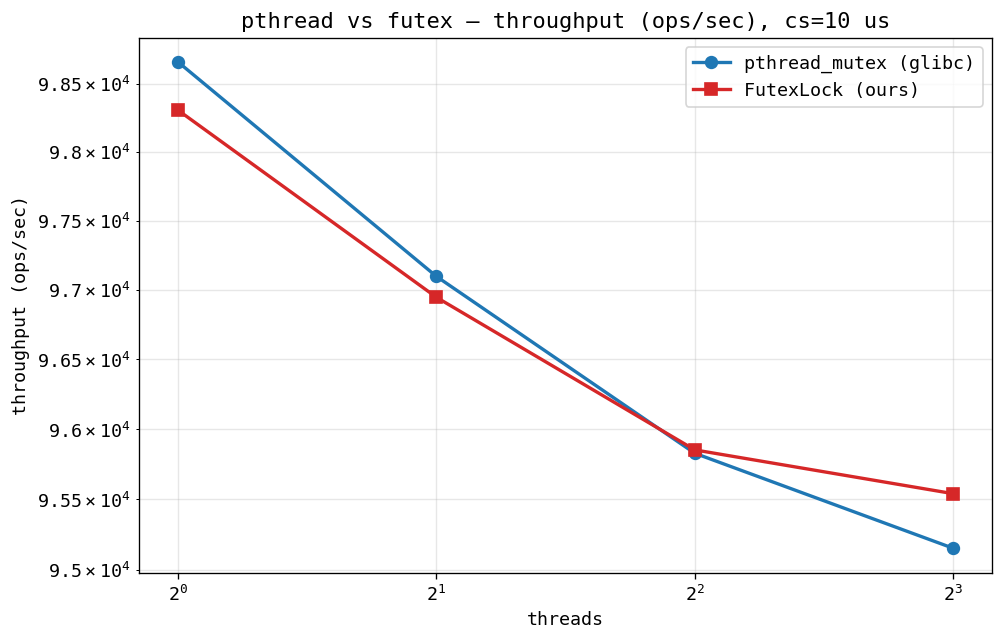
cs=0: FutexLock leads at low P, pthread overtakes from 4 threads on. cs=100 ns and cs=1 µs: FutexLock 5–25% faster (4.2 M vs 3.5 M at 8/100ns; 870 K vs 690 K at 8/1µs). cs=10 µs: tied within 1%, held-time bound.
Throughput, PSC, four CS values.
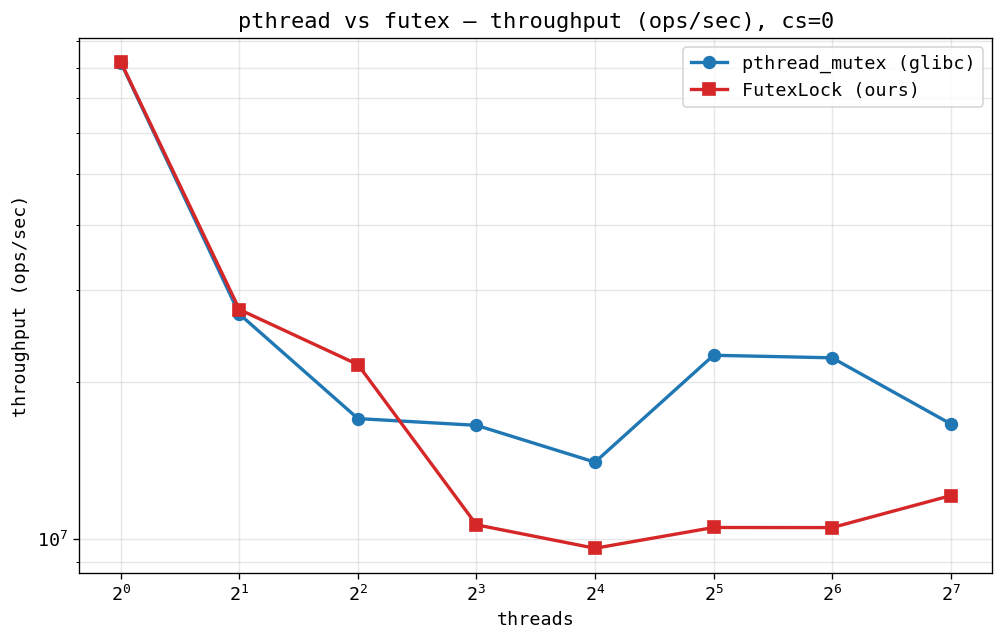
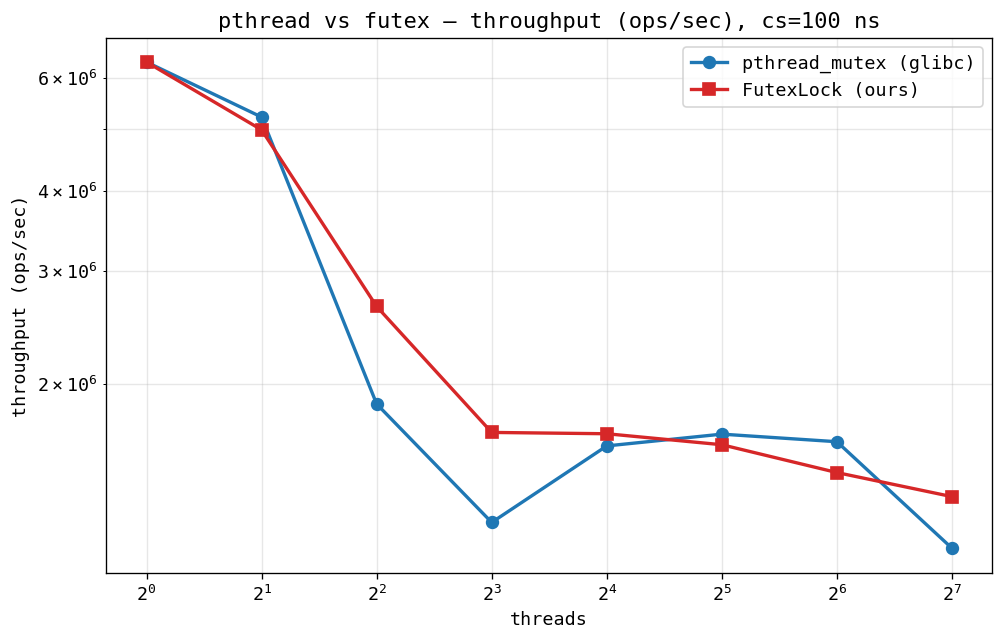
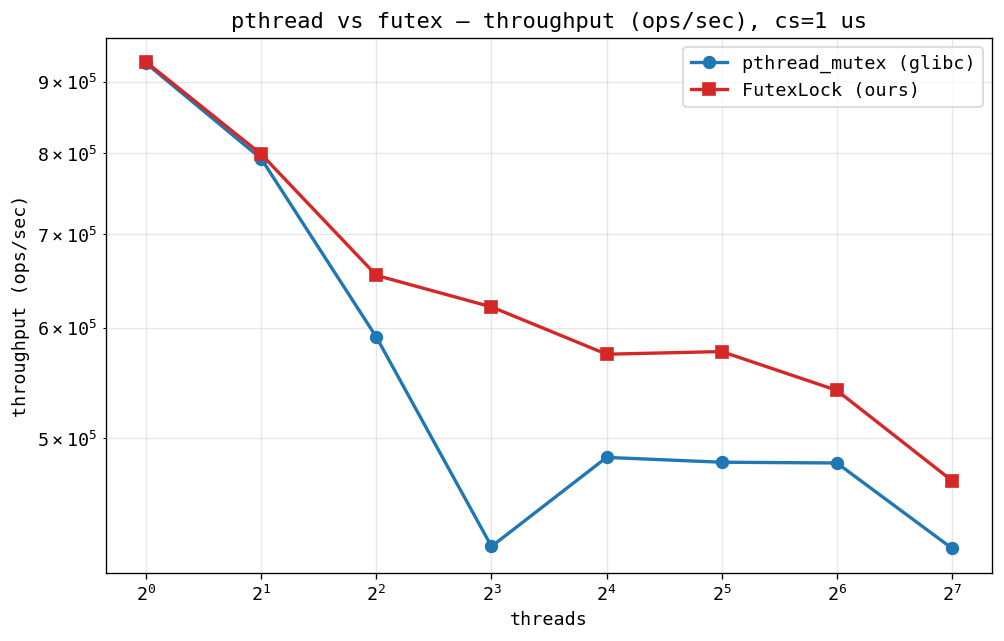
cs=0: tied to 2 threads, pthread ~1.4× ahead from 4 onward out to 128. The dip-and-recover around 16 is glibc's adaptive spin switching regimes. FutexLock flatlines at ~10 M ops/sec from 8 threads. cs=100 ns: tracks closely. cs=1 µs and 10 µs: FutexLock slightly ahead at most P.
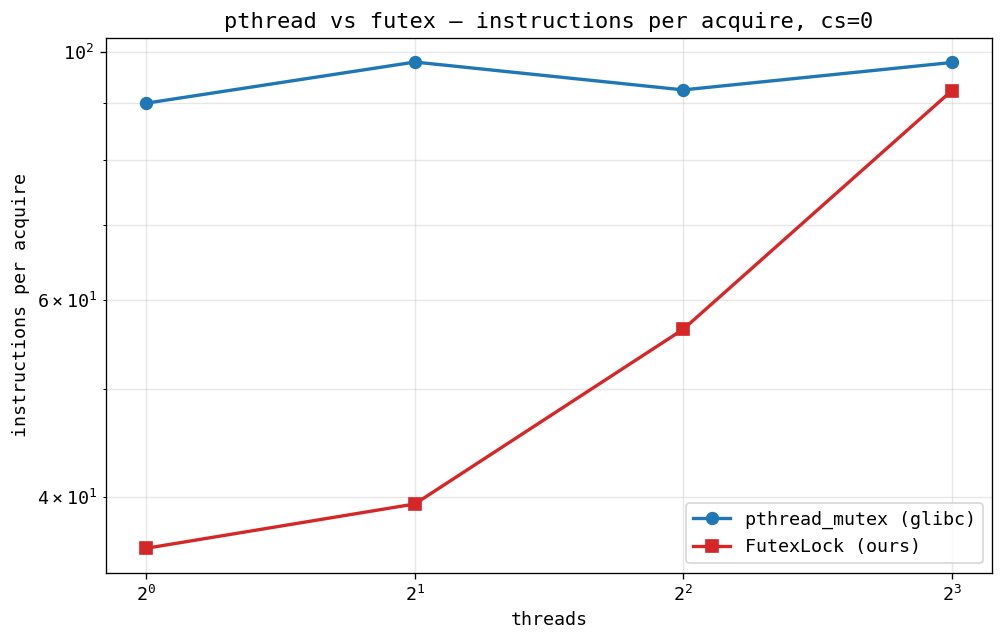
HW counters at cs=0, GHC.
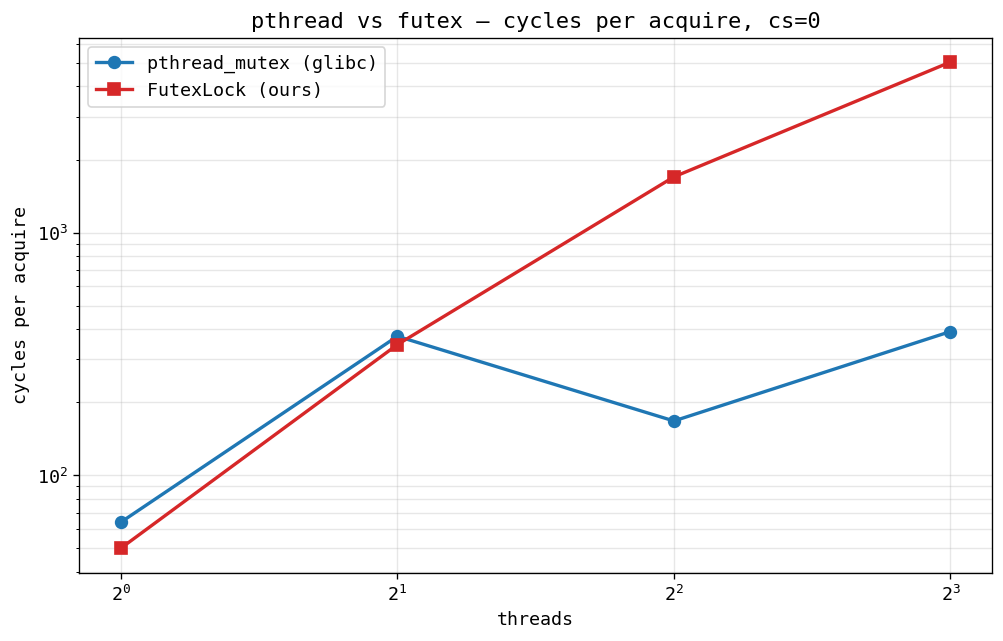
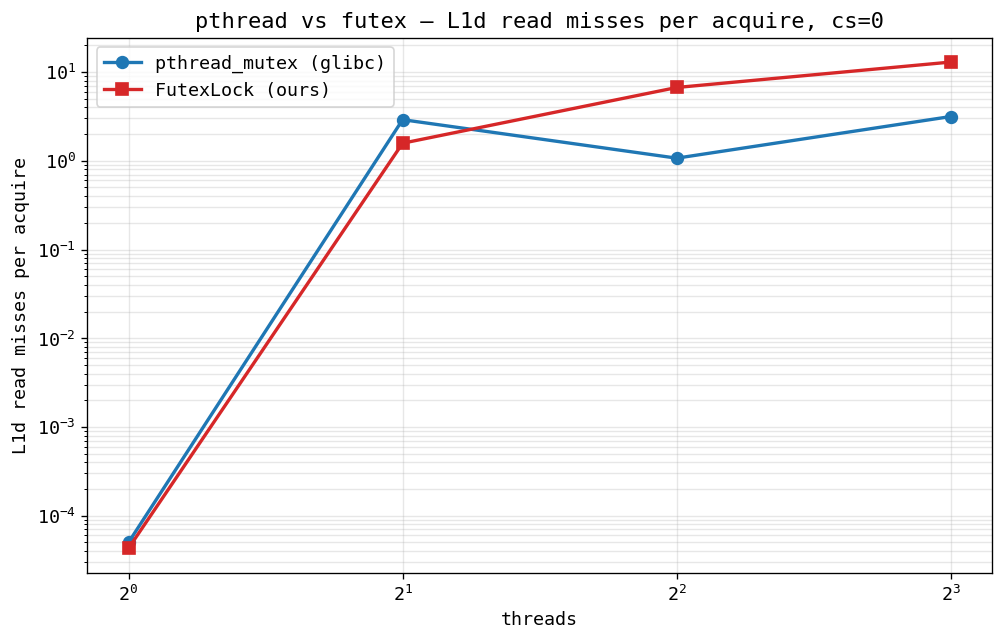
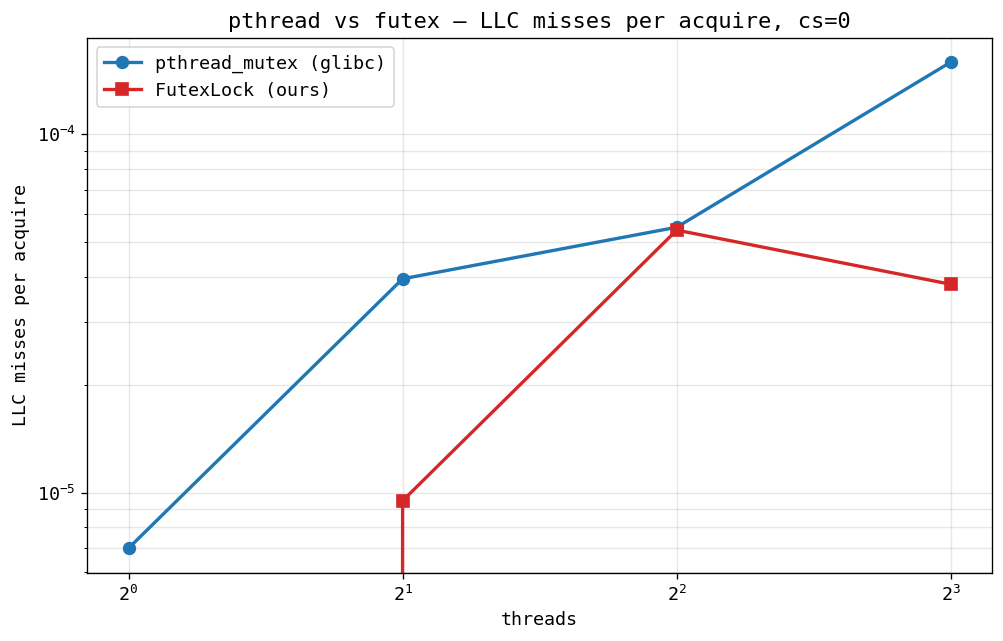
Cycles: FutexLock burns 1700 at 4 threads, 4000 at 8; pthread
stays at 170–380. The 64-iteration spin budget is the
culprit; spinners never see unlock at cs=0, so the
budget is pure waste before futex_wait.
Instructions: fewer for FutexLock (35–90 vs
80–100), so cycles are stalled on coherence, not
retiring. L1d: ~4× more for FutexLock (re-reading state).
LLC: pthread ~4× higher (FUTEX_WAKE hits
cross-core scheduler state).
HW counters at cs=0, PSC.
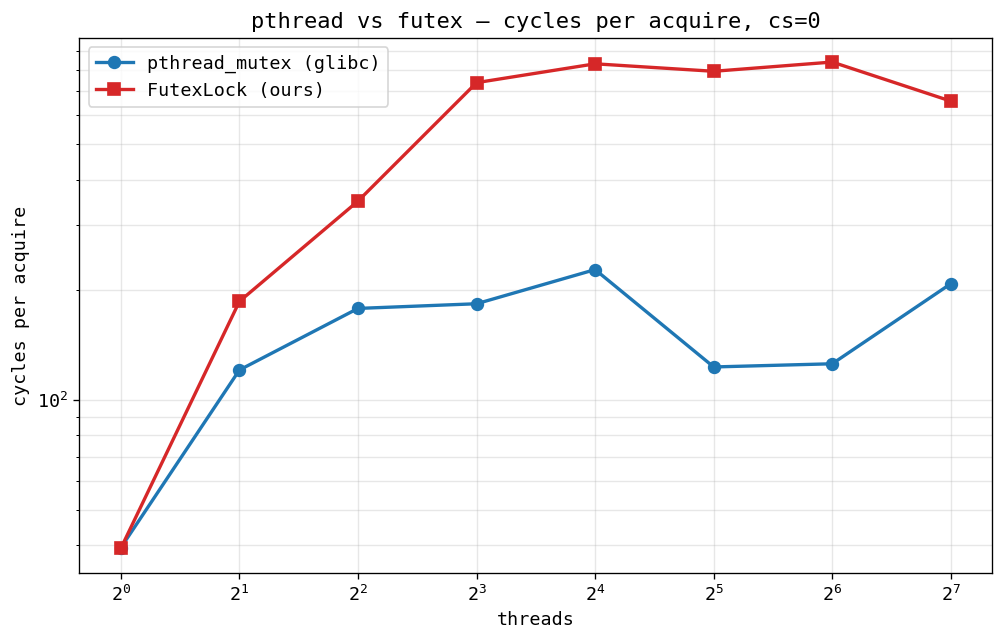
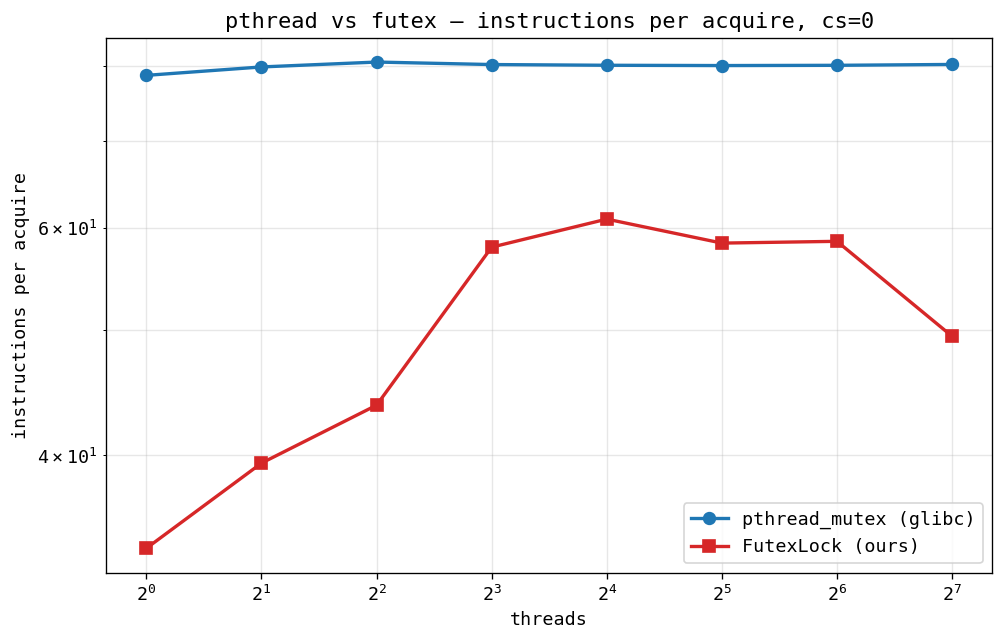
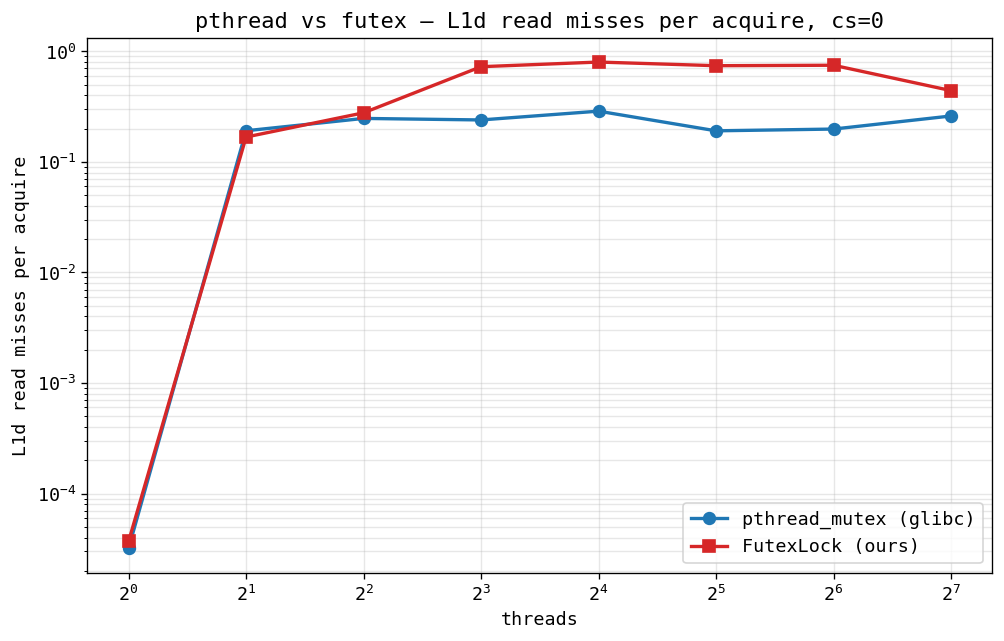
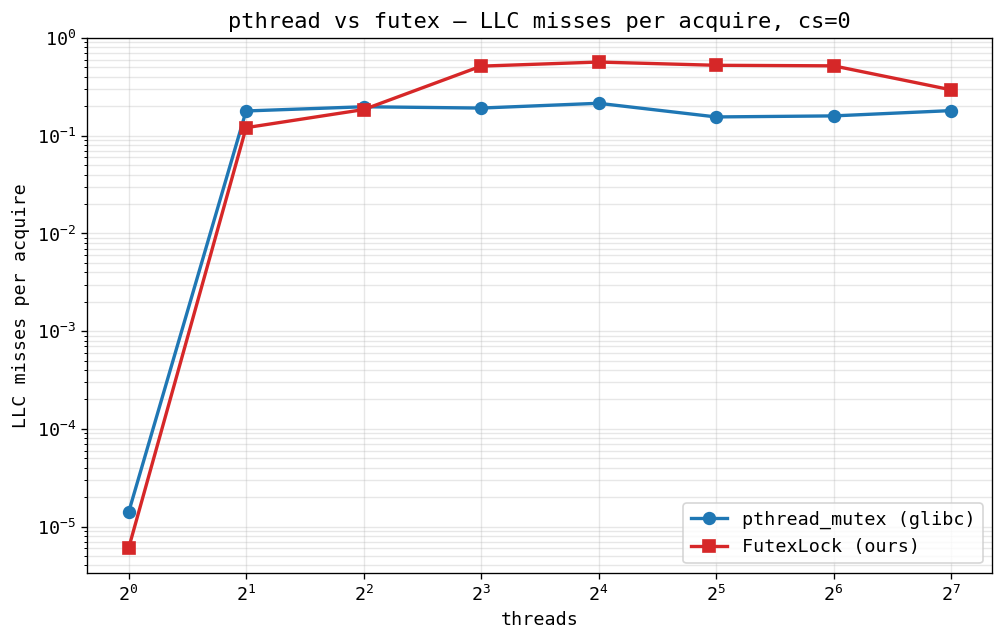
Same pattern, larger gap. From 16 threads on, FutexLock is ~5–6× more cycles per acquire; pthread stays flat ~150 cycles. L1d/LLC tradeoff preserved on Zen 2: more L1d traffic from spinning, less LLC since we don't pay the cross-socket wakeup. PSC makes the spin-budget loss louder. This is where glibc's adaptive spinning earns its keep.
Verdict. A 50-line lock built directly on
SYS_futex matches or beats glibc's
pthread_mutex on every regime where the critical
section does any work, on both GHC and PSC. On GHC we even
beat pthread by ~2× on the uncontended fast path; on
PSC the fast paths are tied because glibc's overhead has been
tuned down for high-core-count machines. The one regime where
we consistently lose is cs=0 with many threads: glibc's
adaptive spinning transitions to futex_wait much
sooner than our fixed 64-iteration budget, so contended
threads burn fewer cycles before sleeping. Most of
pthread's perf comes from the futex idea (~50 LoC to
implement) and the rest from a single piece of production
engineering: adaptive spin tuning. The architectural
choice (block vs spin) carries the day, not the specific
glibc implementation.
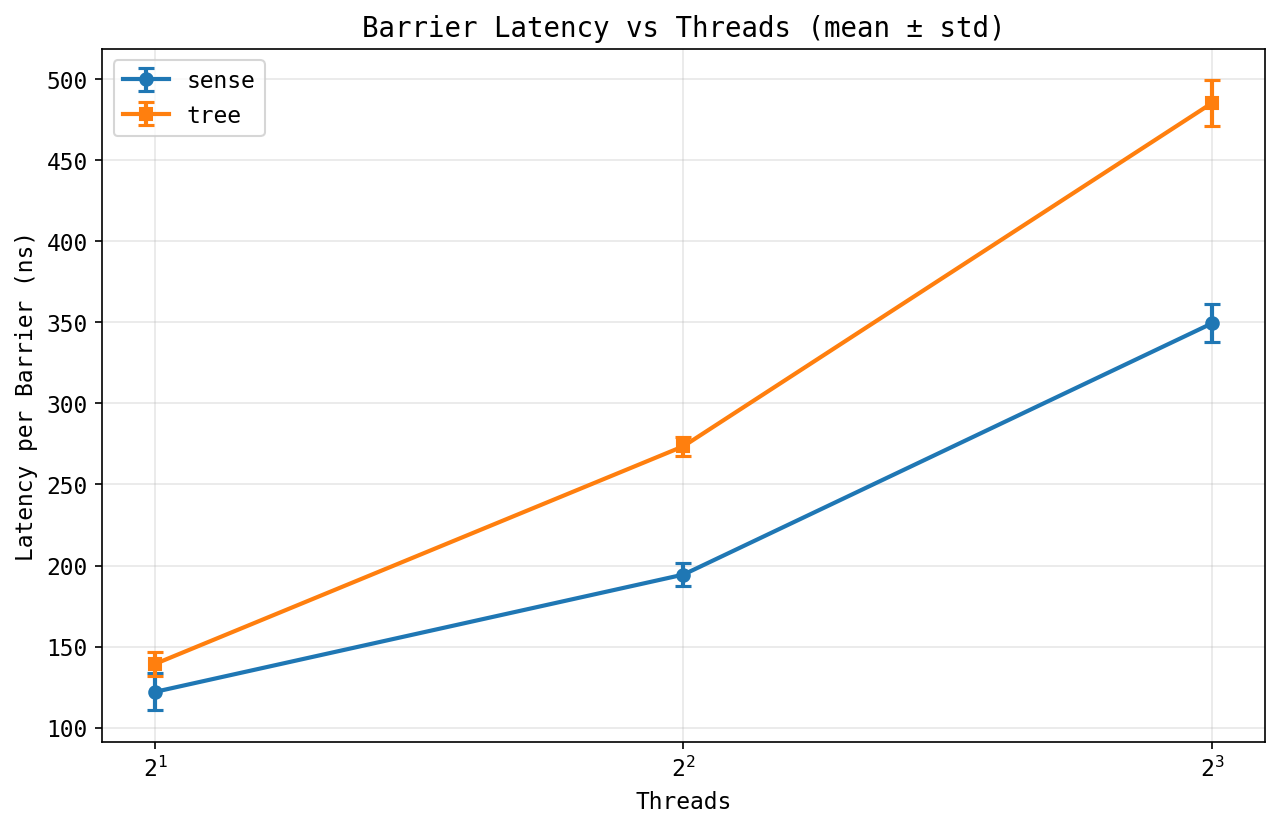
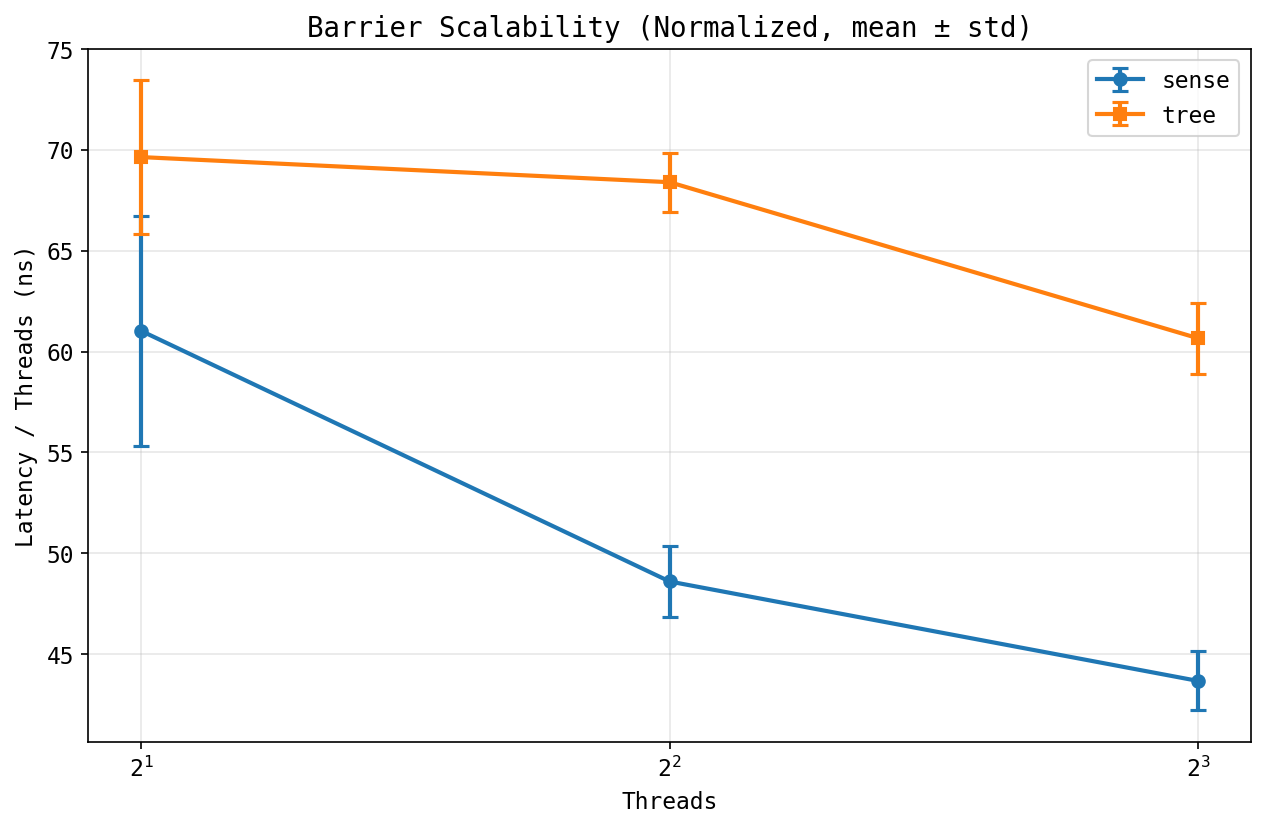
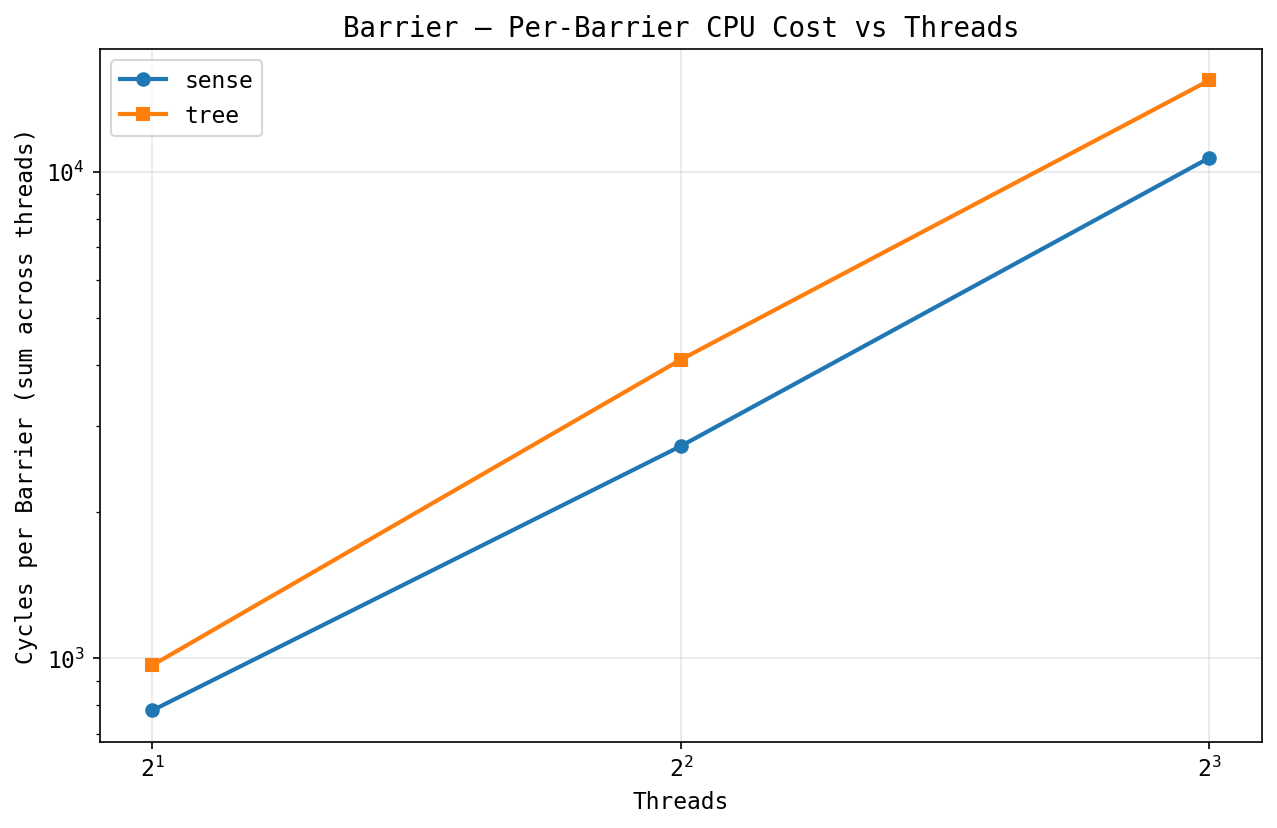
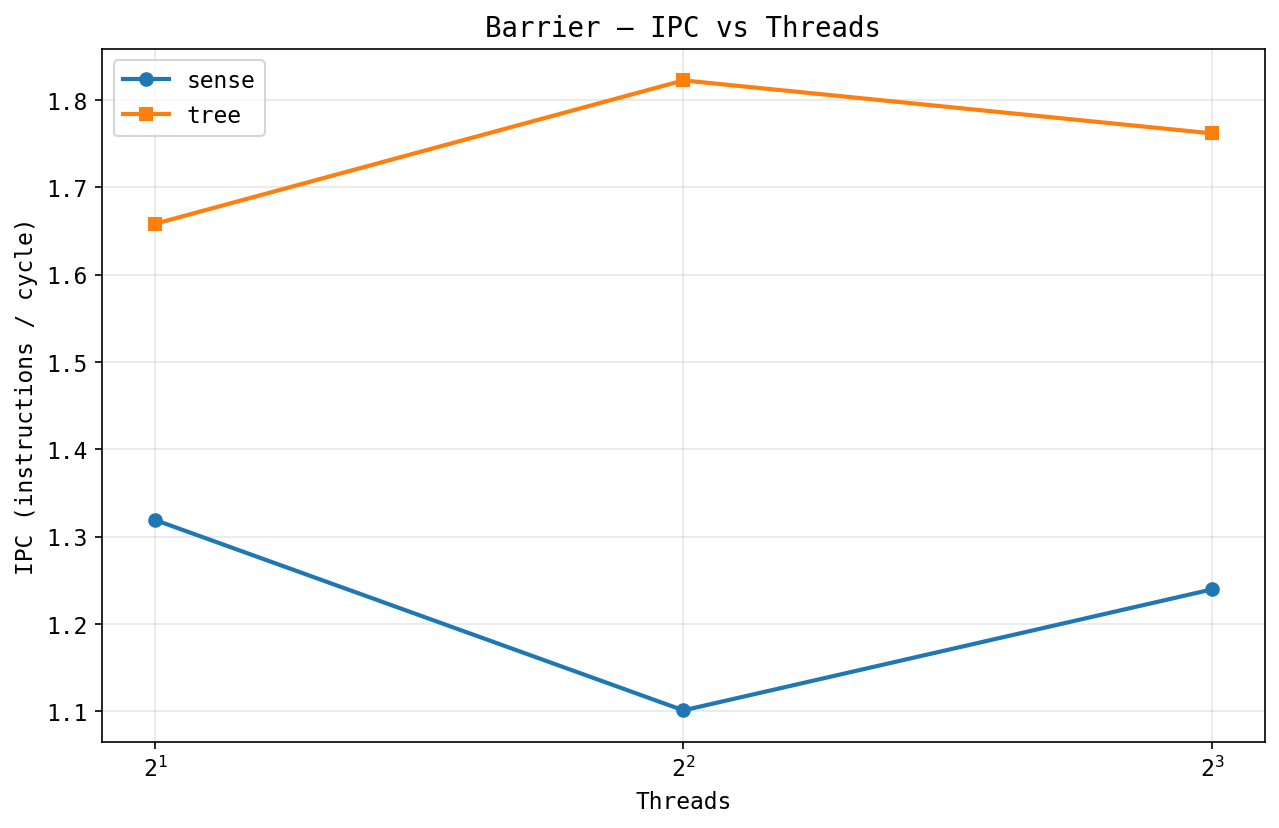
Latency rises with threads for both. Tree wins at higher P because per-phase cost is O(log P) vs sense's O(P). The scalability plot divides by thread count: tree flattens, sense grows. Cycles per barrier tracks the same shape. IPC: tree spins more efficiently than sense, but neither does useful work; it's all spin overhead.
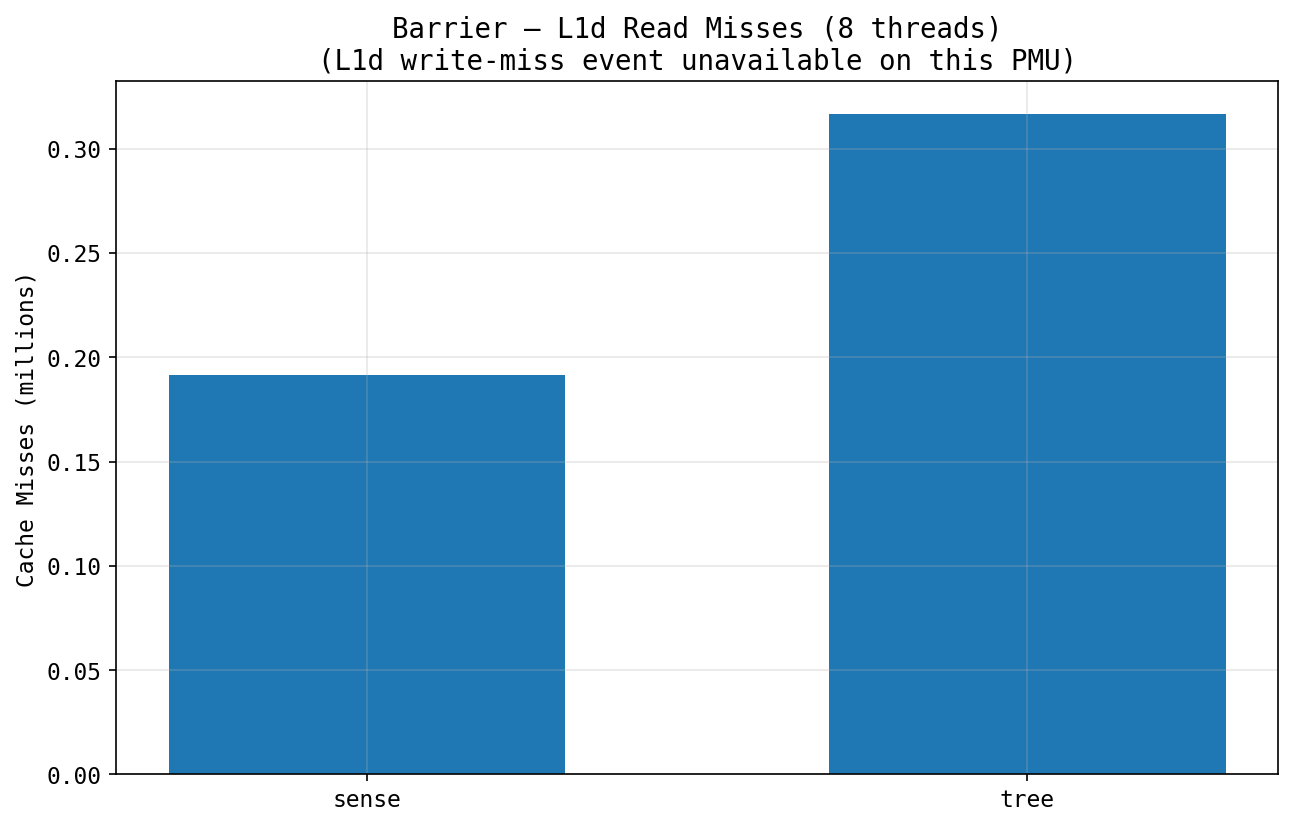
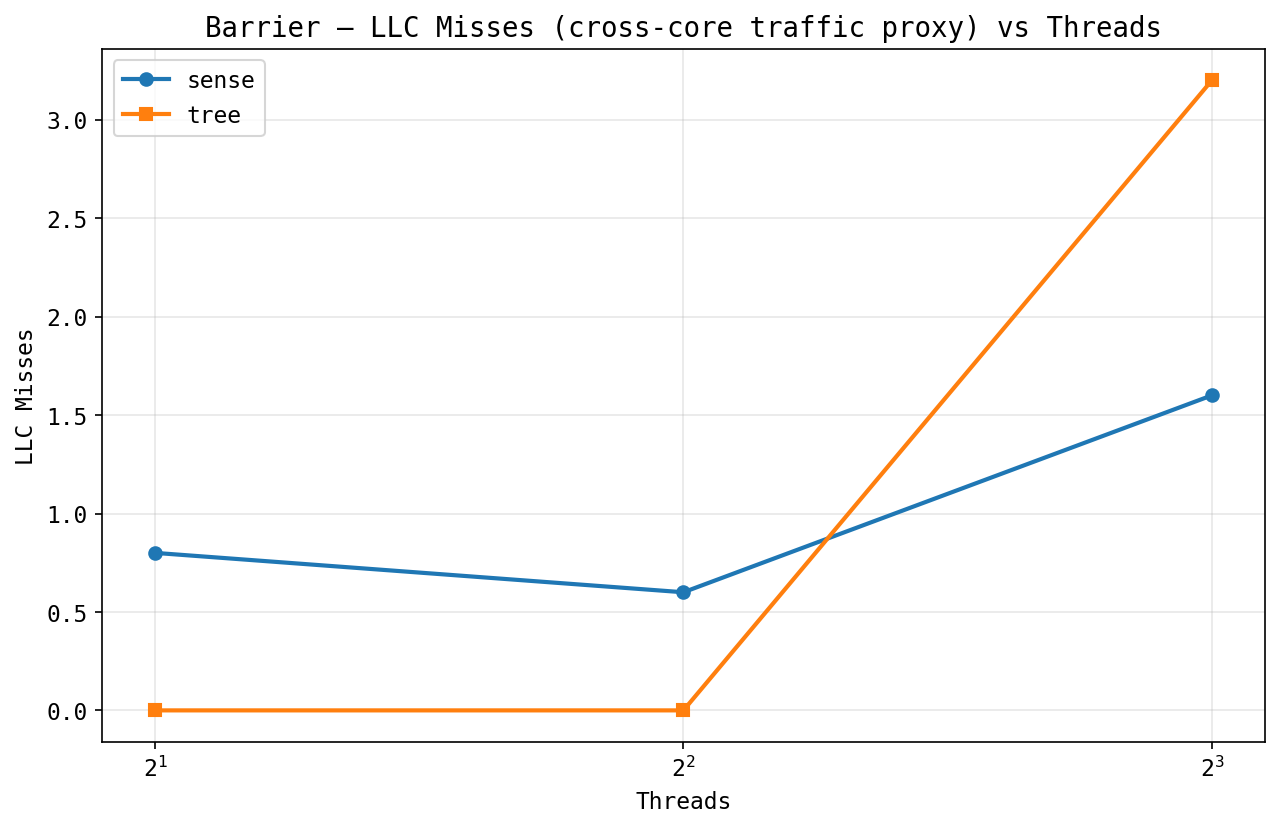
Cache view: sense's centralized counter is write-invalidation dominated; every increment ages all other cores' copies. Tree's per-thread spin is mostly reads. LLC: sense generates roughly 10× more cross-core traffic than tree under contention.
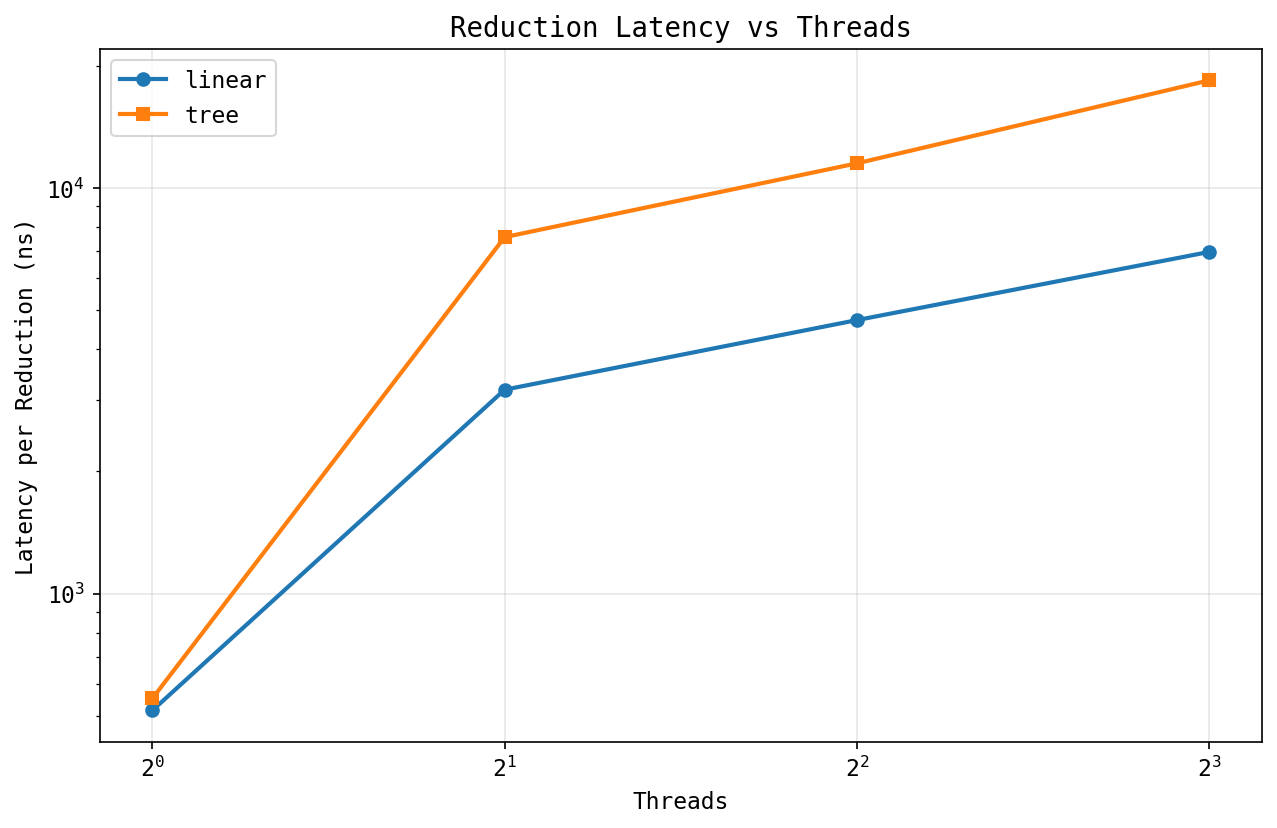
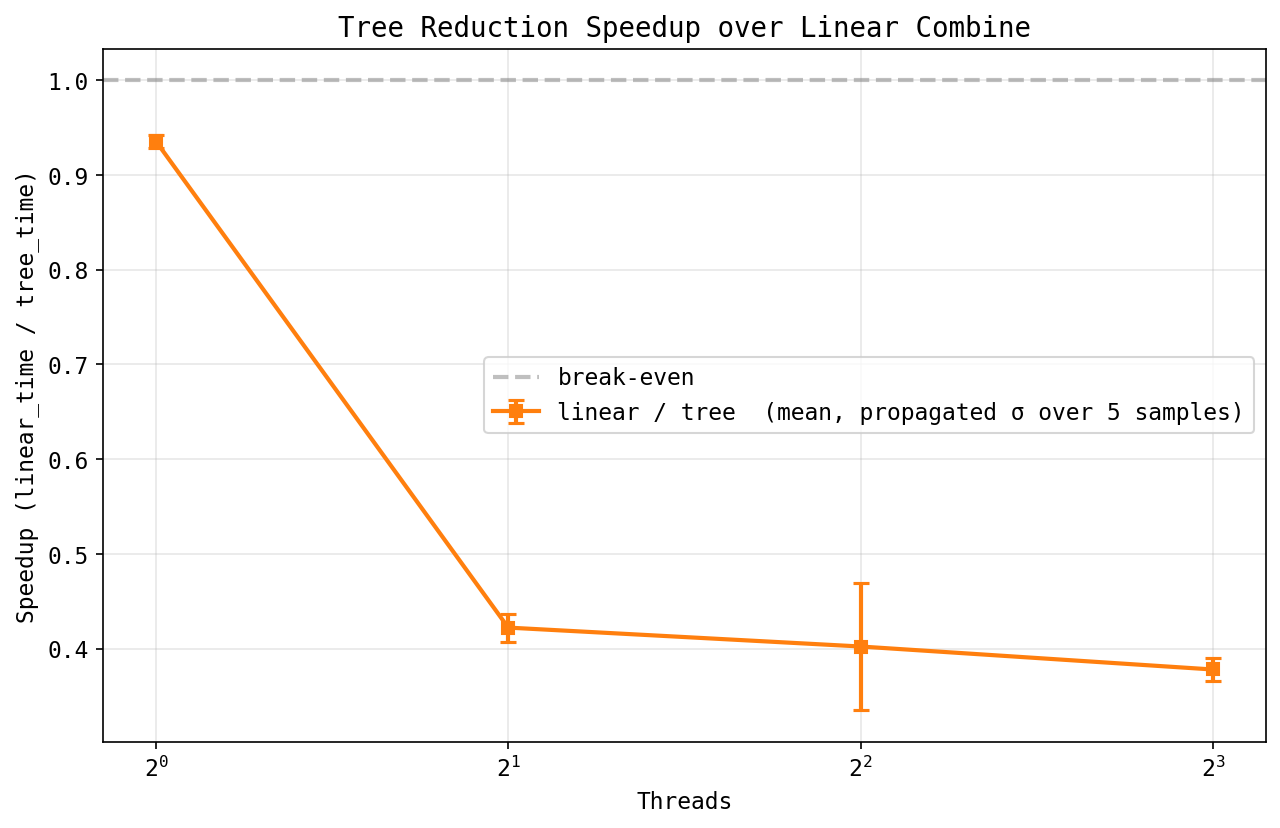
Workload: long-long integer sums, trivial combine.
Linear beats tree at every thread count up to
nproc. Math: linear costs N ×
combine_cost; tree costs log P ×
barrier_cost. Our combine is ~1 ns (integer add); our
barrier is ~500 ns (pthread_barrier_wait).
Crossover at N ≈ 500; well
above any reasonable thread count for cheap combines. Tree
only wins with expensive combines or very large P;
we vary both in the cross-machine section.
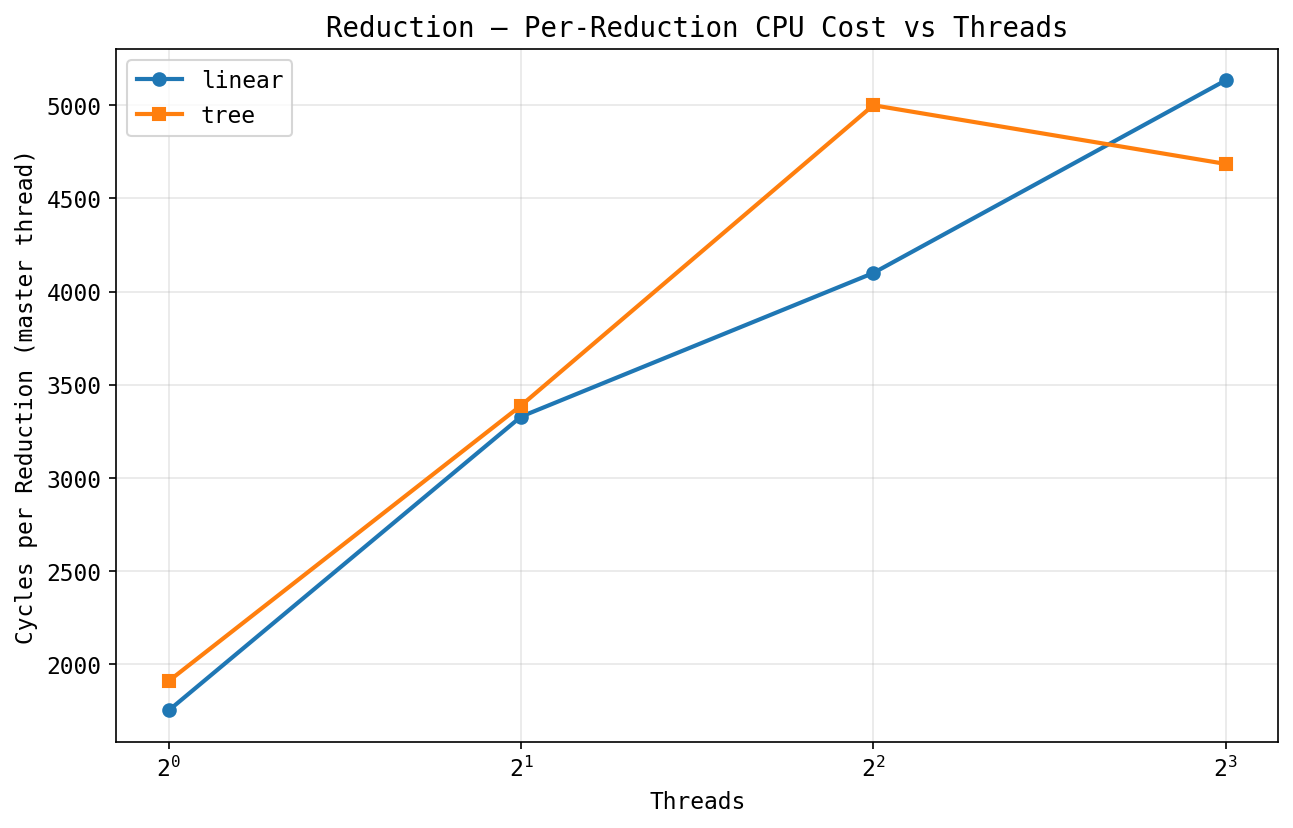
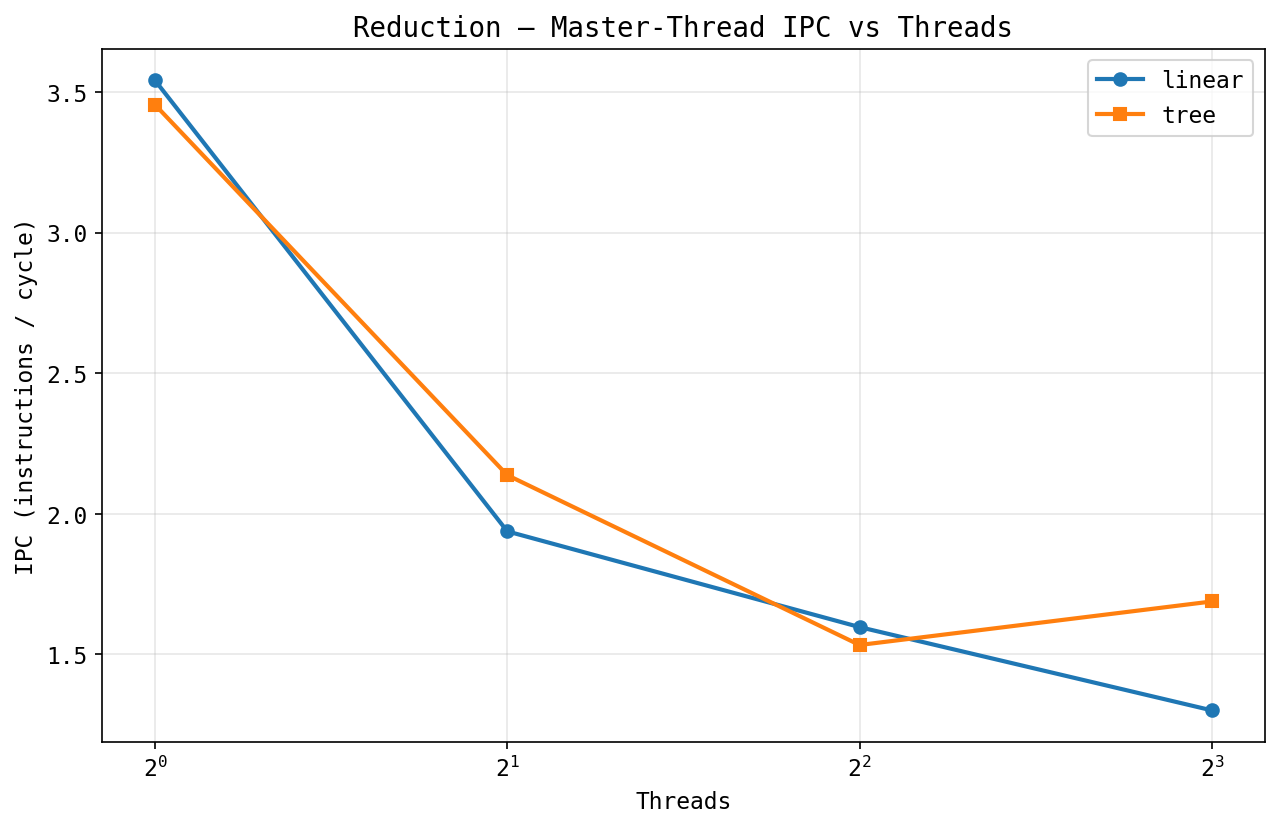
The cycle plots show where the cost goes: tree's master burns cycles in barrier waits (low IPC); linear's master is in a tight add loop (high IPC). Tree is ~3× more master cycles for the same work.
Pi. Embarrassingly parallel, independent
per-thread RNG. All three schedulers cluster near ideal ;
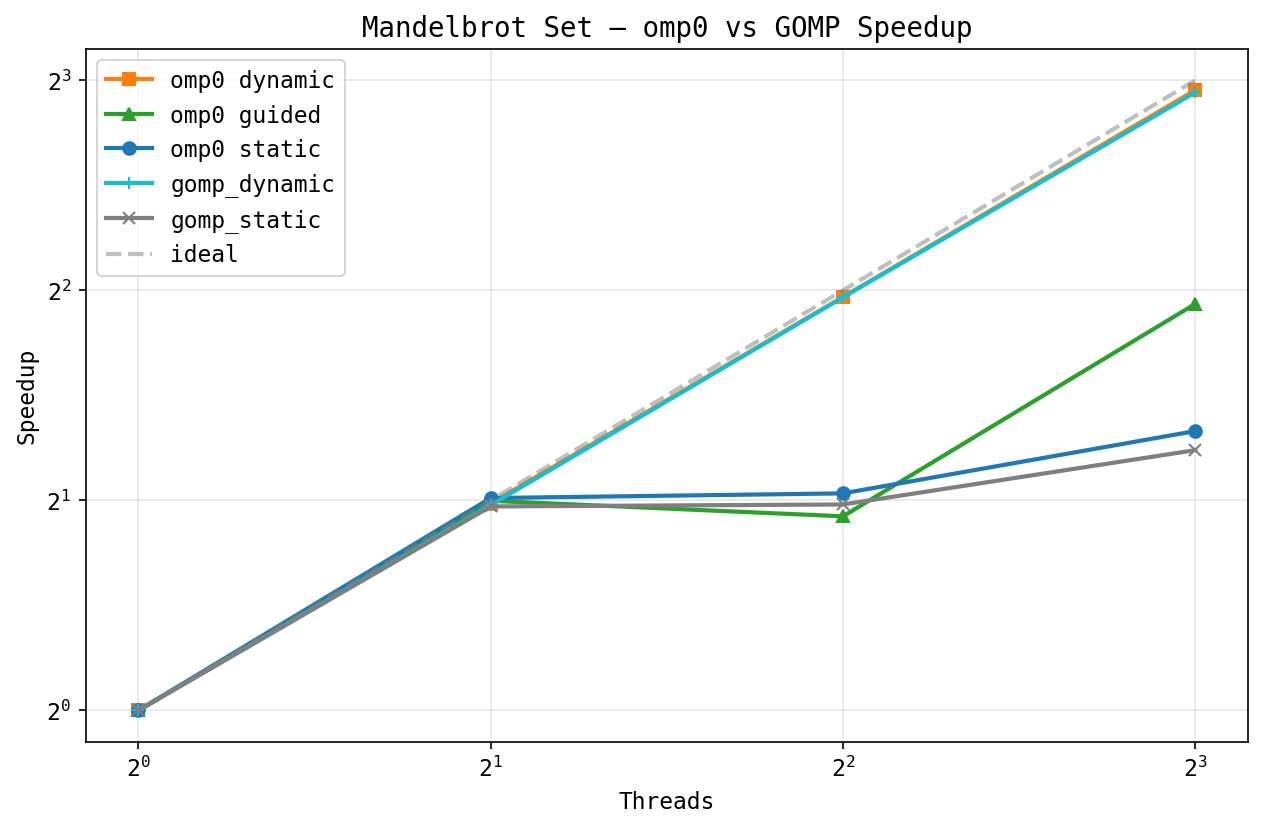
nothing to load-balance. vs GOMP: our static is competitive;
GOMP's dynamic is slightly faster (chunk-stealing vs our
single shared fetch_add).
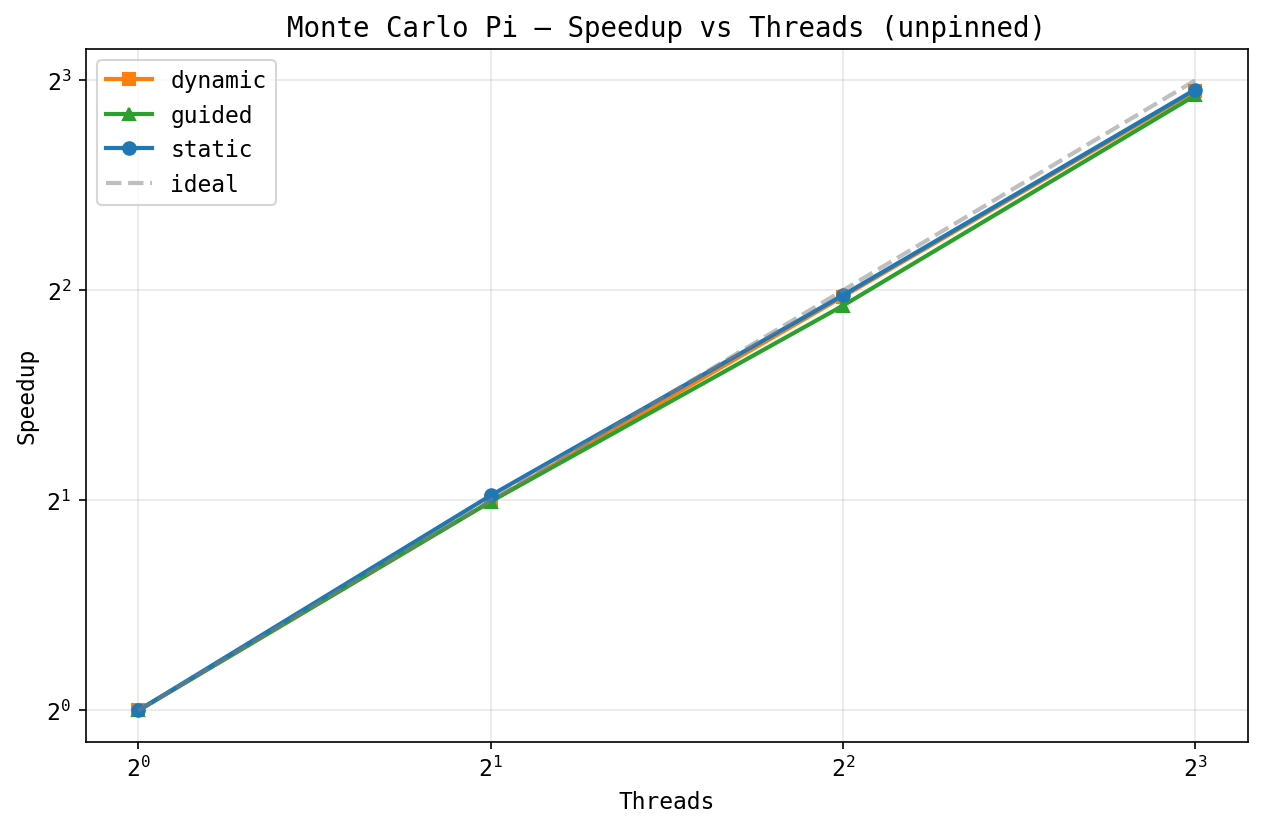
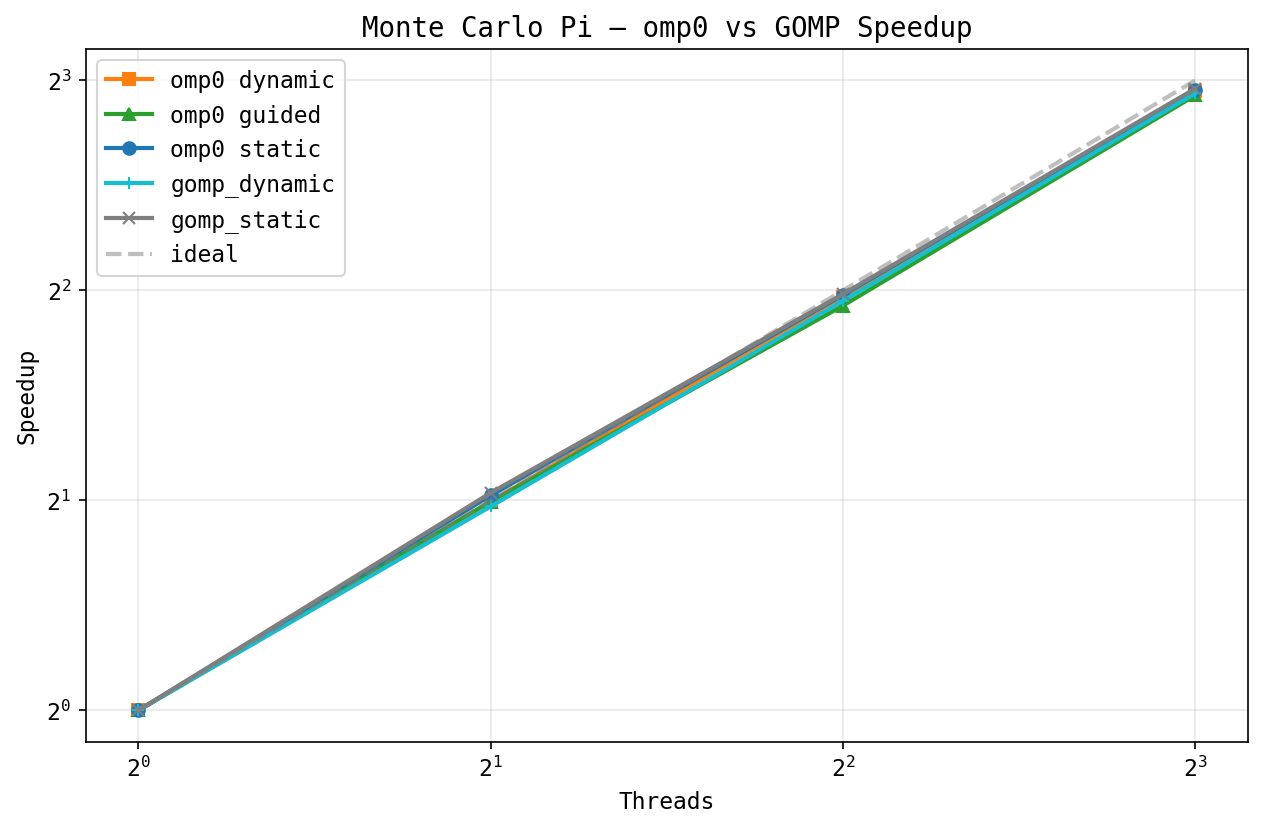
Matmul (256×256). ~4–5× at 8 threads. Static and dynamic track each other; row-level work is uniform. Cache-bound at this size; bigger N would scale further.
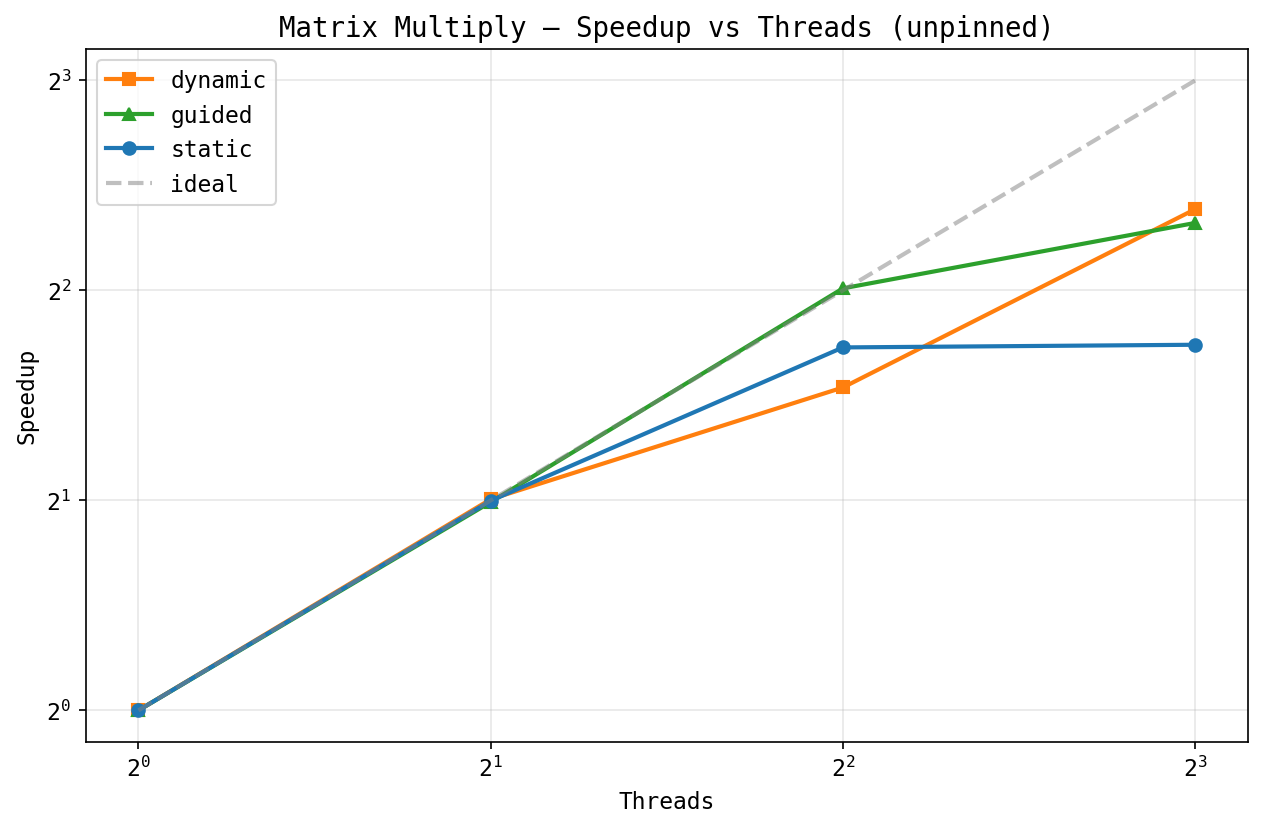
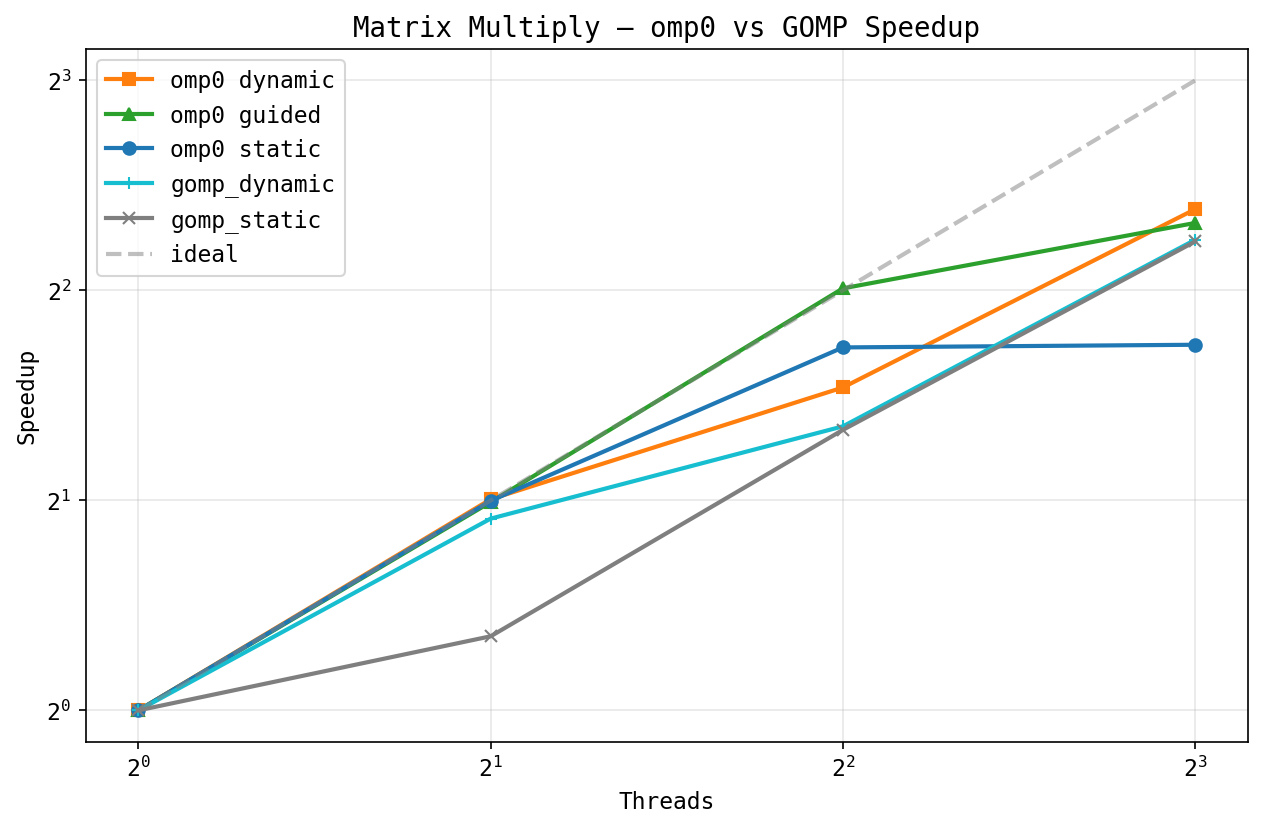
Mandelbrot. Per-row work is highly imbalanced (boundary pixels need up to 500 iters; exterior bails out fast). At 8 threads: dynamic ~7.5× (near-ideal), guided ~4×, static ~2×. Only dynamic chunk-stealing handles the imbalance.
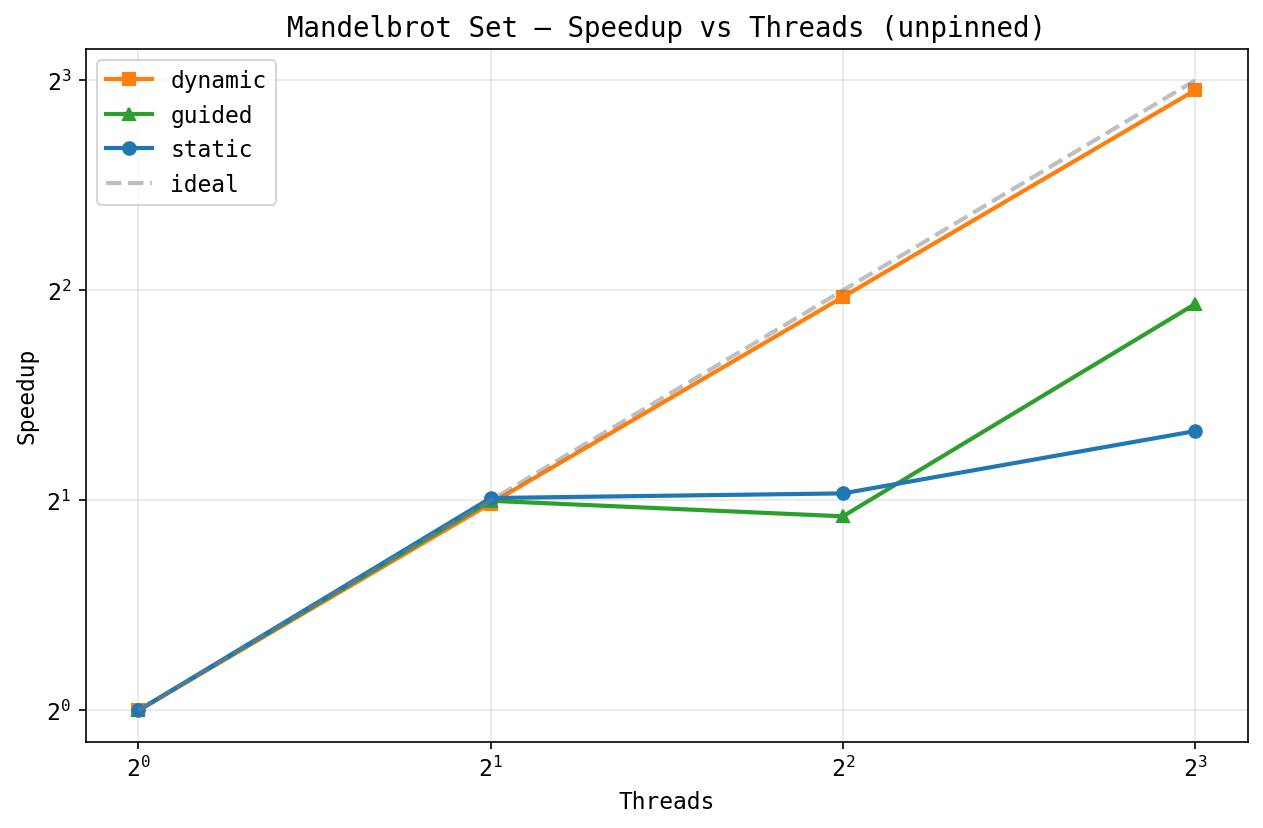
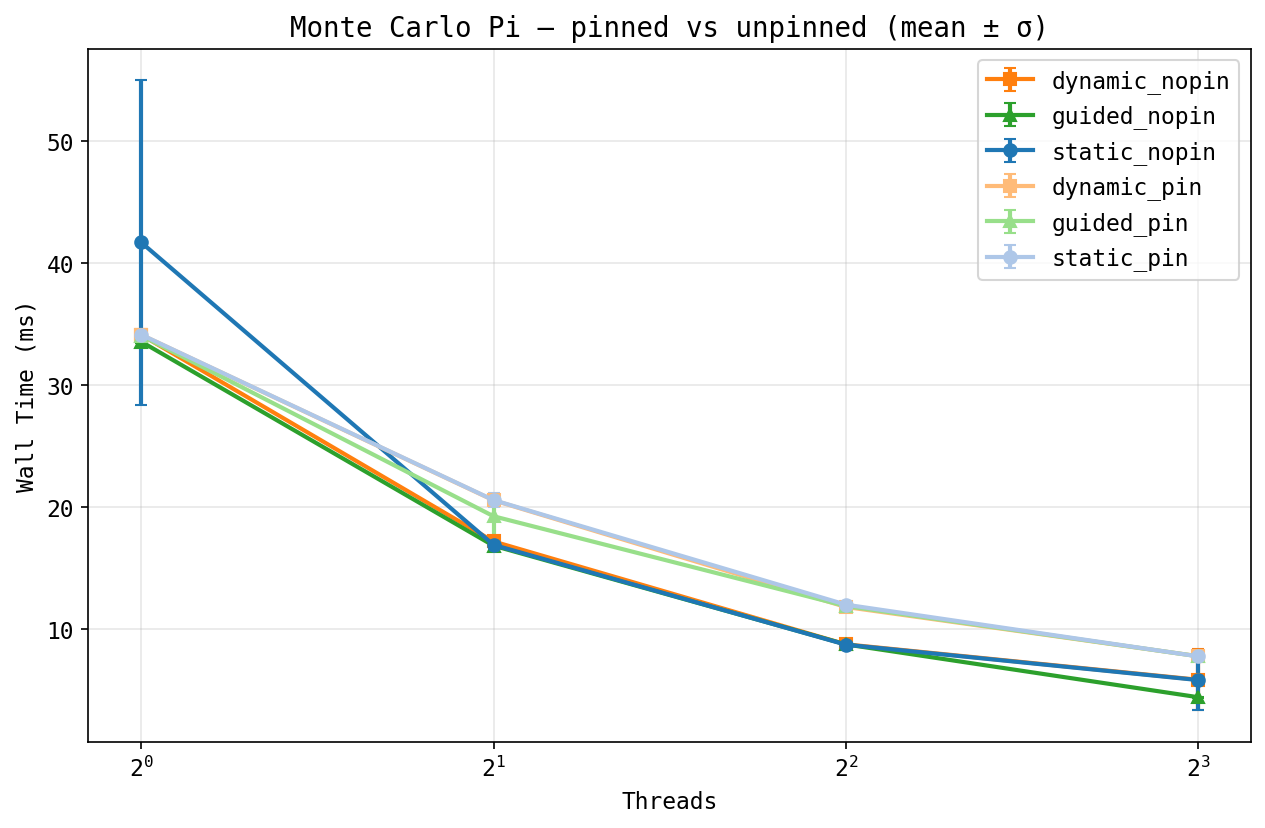
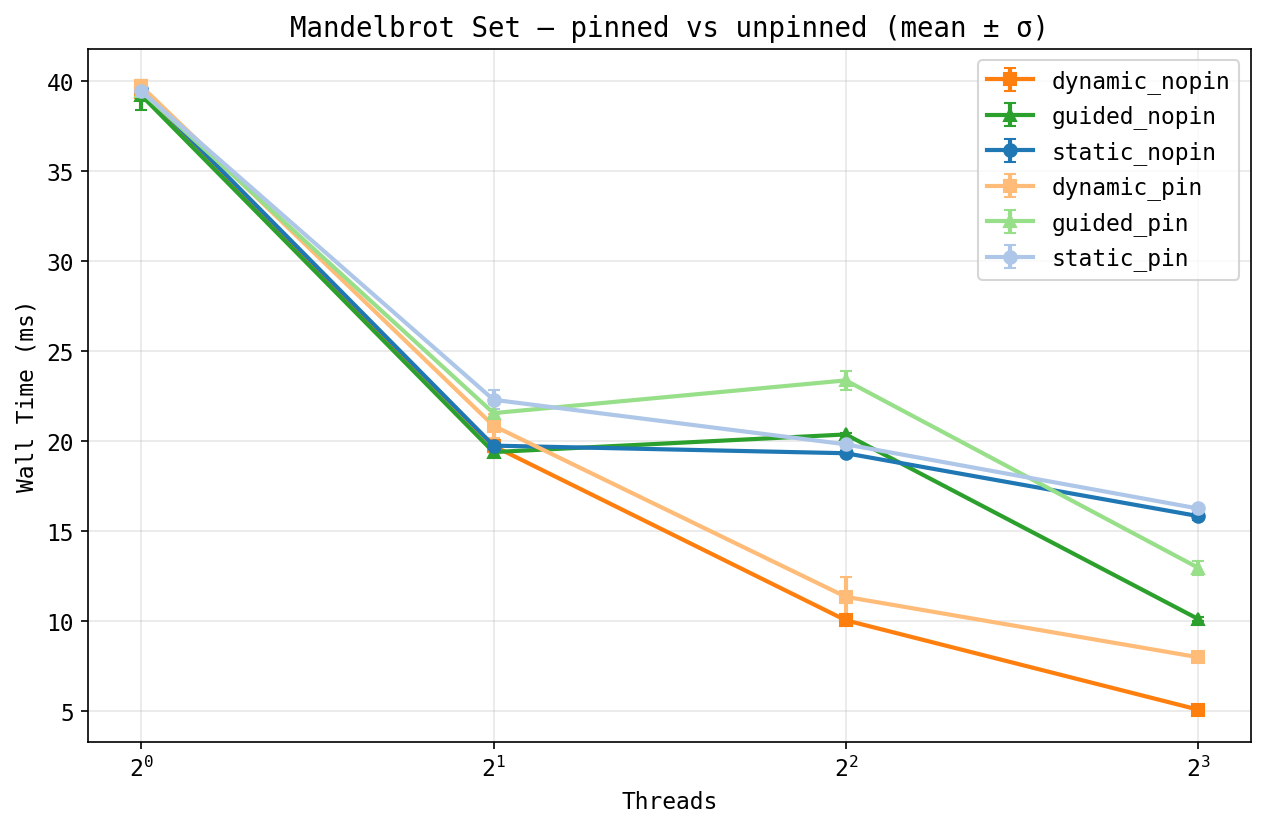
Pinning. Two stories: Mandelbrot benefits (chunked iteration has cache locality to protect, OS migration mid-chunk hurts). Pi is slightly slower with pinning (no shared cache pressure; affinity just prevents migration off a busy core). Pinning helps only when the workload has memory locality.
Bug we hit. First speedup run showed every
variant flat at ~1×. Cause: sticky pinning.
pthread_setaffinity_np is persistent per-thread
and inherited at thread create. The bench loops
{nopin, pin} per scheduler. After the first
pin=true iter pinned master to core 0, every
later pin=false iter spawned workers that
inherited the affinity; the whole team serialized on
core 0. Fix: explicitly reset affinity in
ThreadPool construction and in worker startup.
GHC at 8 cores shows pthread is not fastest on short CS. PSC at 128 inverts that. Discussed in the cross-machine section.
Dual-socket EPYC 7742, 128 cores. The app kernels follow the same pattern as GHC (dynamic dominates Mandelbrot, static dominates matmul, all three converge on Pi), just stretched to 128 threads; not reproduced here. The interesting PSC results are the lock and barrier sweeps: 128 contending threads across two sockets exposes coherence behavior the 8-core box can't.
Lock throughput at high contention is where Bridges-2 is most informative. The throughput plots at cs=0 and cs=10 µs on the left and right show the two ends of the workload spectrum at 128 threads.
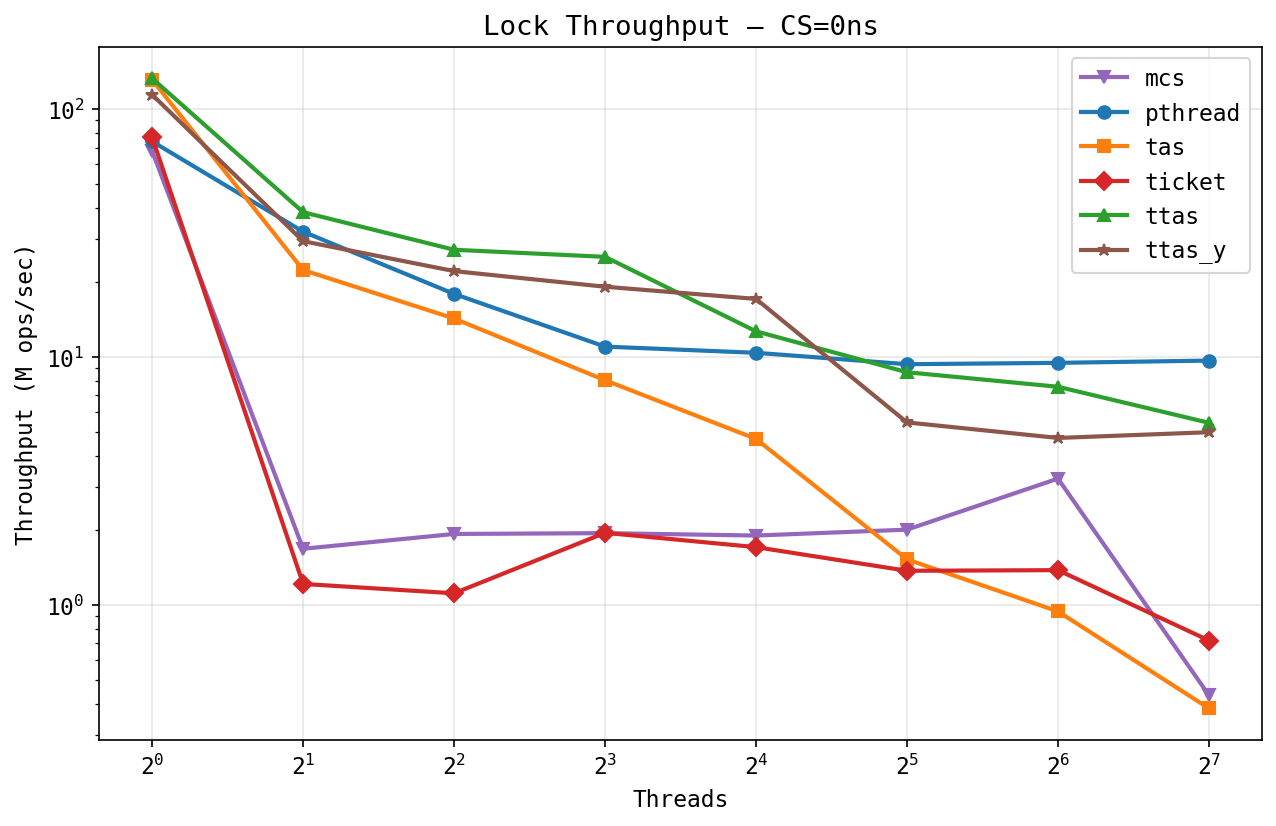
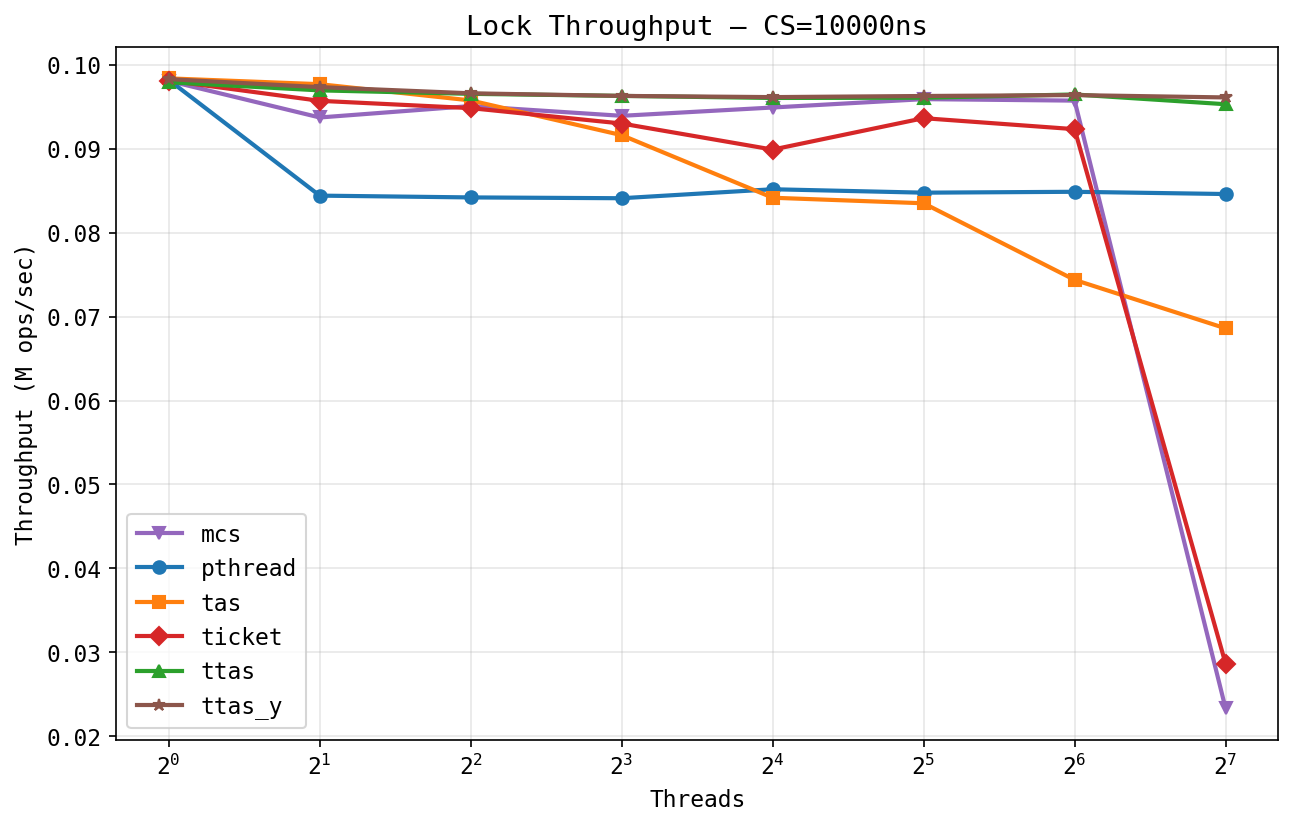
At 128 threads, cs=0, the rank order finally inverts compared to GHC: pthread holds at ~9 M ops/sec, while ticket and MCS collapse to under 0.5 M ; a ~30× gap. TTAS and TTAS-yield sit around 5 M; TAS degrades to ~0.4 M because every spin is a write storm at this contention. The cache-coherence cost of any spinlock at 128 threads now exceeds the cost of a Linux futex roundtrip (~500 ns on bare-metal AMD), so pthread wins decisively. With a 10 µs critical section everyone is bounded by held-time, but ticket and MCS still collapse at 128 threads to ~0.015 M (the FIFO-queue + preemption cliff), 5× worse than the non-FIFO variants; pthread holds steady throughout, a small constant cost from futex wakeups but no collapse. The lock that wins changes with the platform's futex-cost-versus-coherence-cost ratio, exactly the GHC finding flipped the other way.
Cycle accounting and L1d/LLC traffic at high contention. The 2×2 below covers per-acquire cycles, per-cycle L1d miss rate, total LLC misses, and per-cycle LLC miss rate at 128 threads.
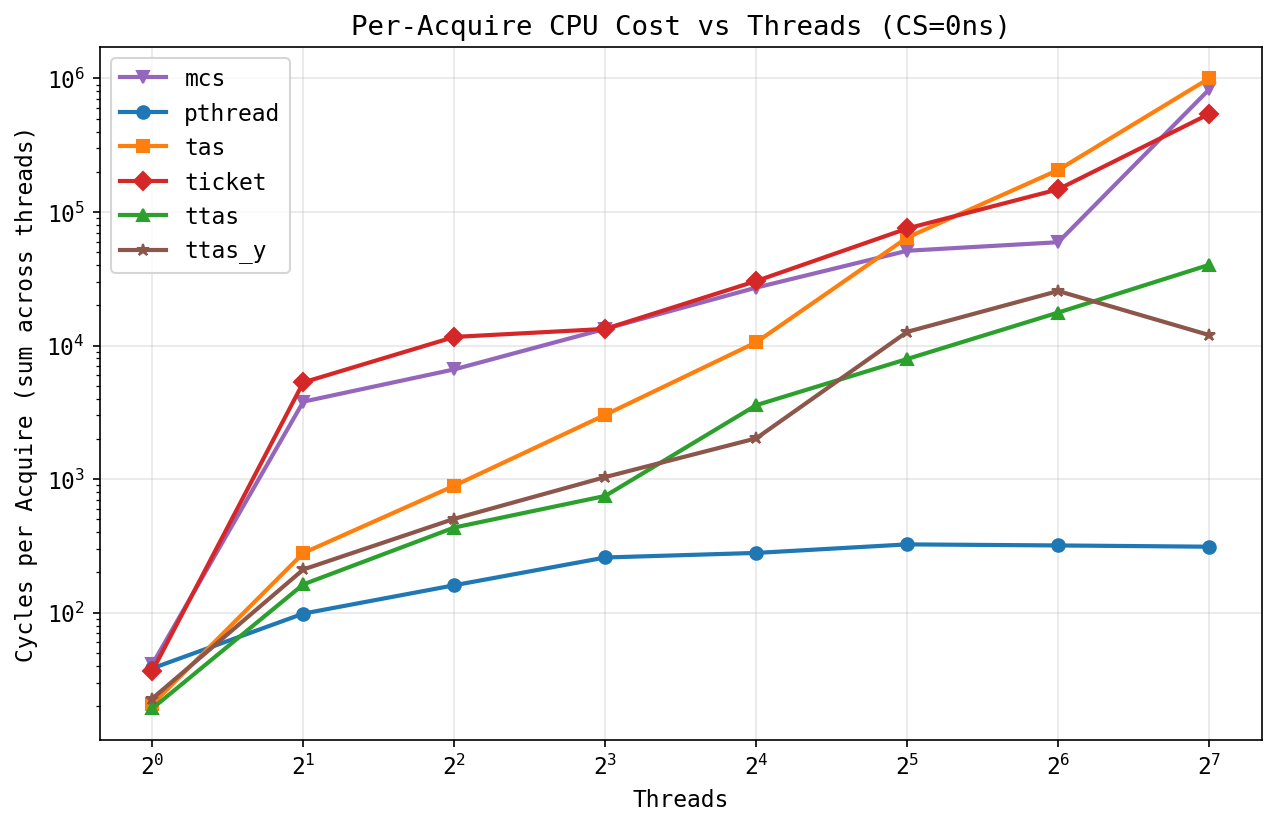
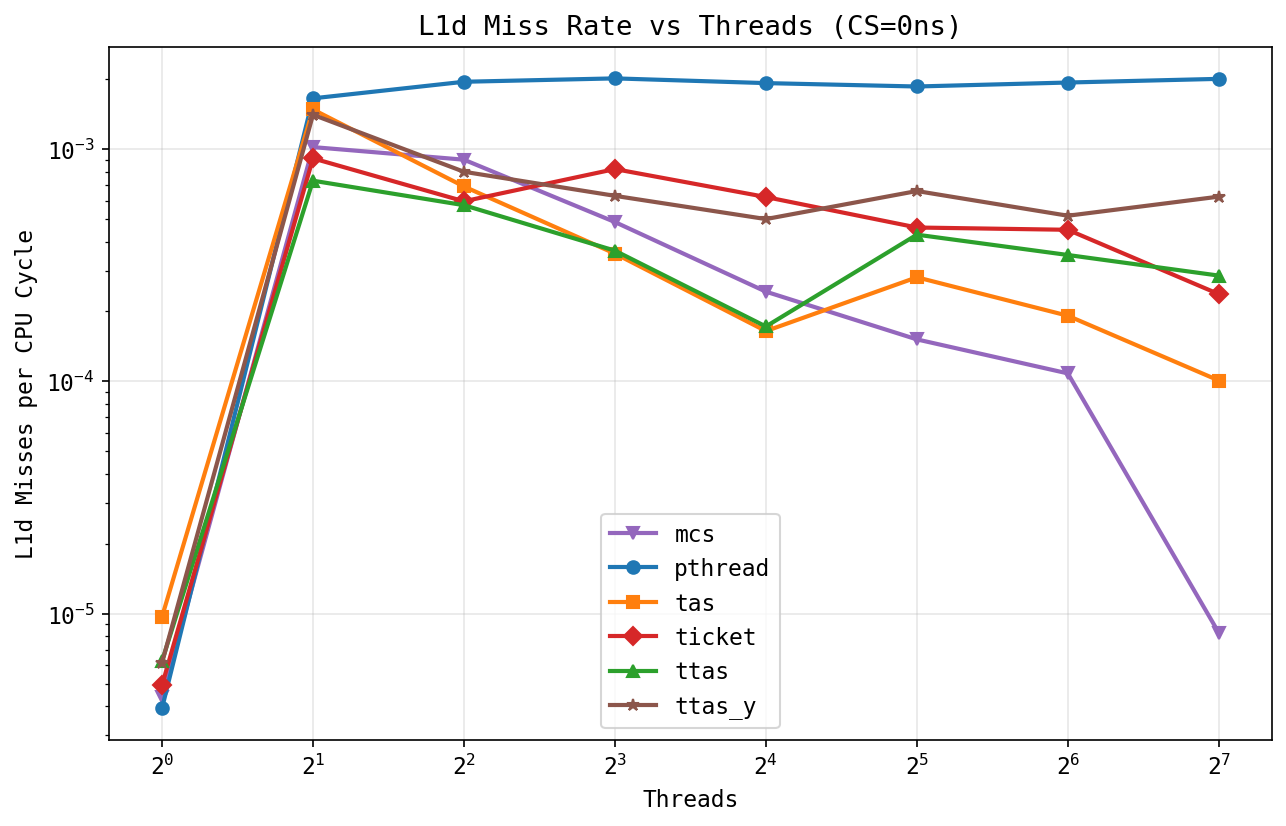
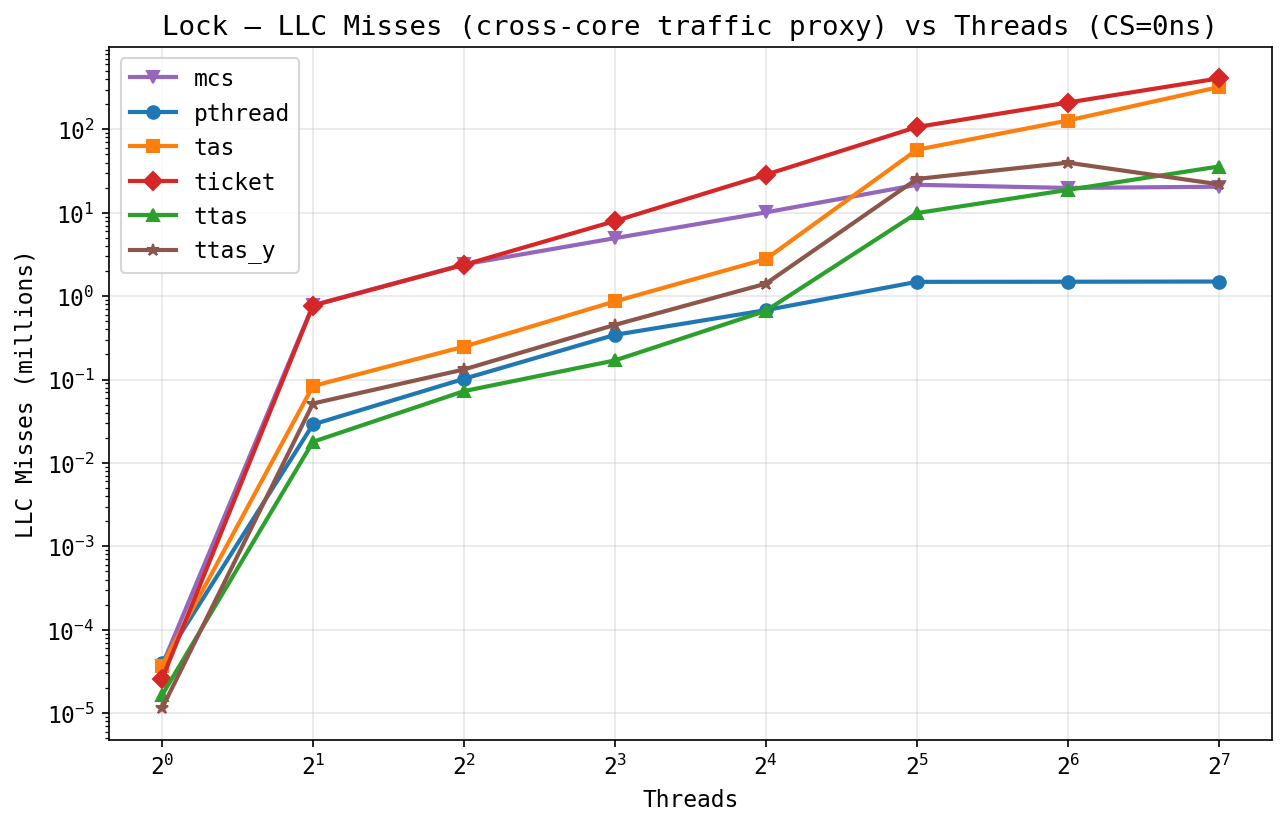
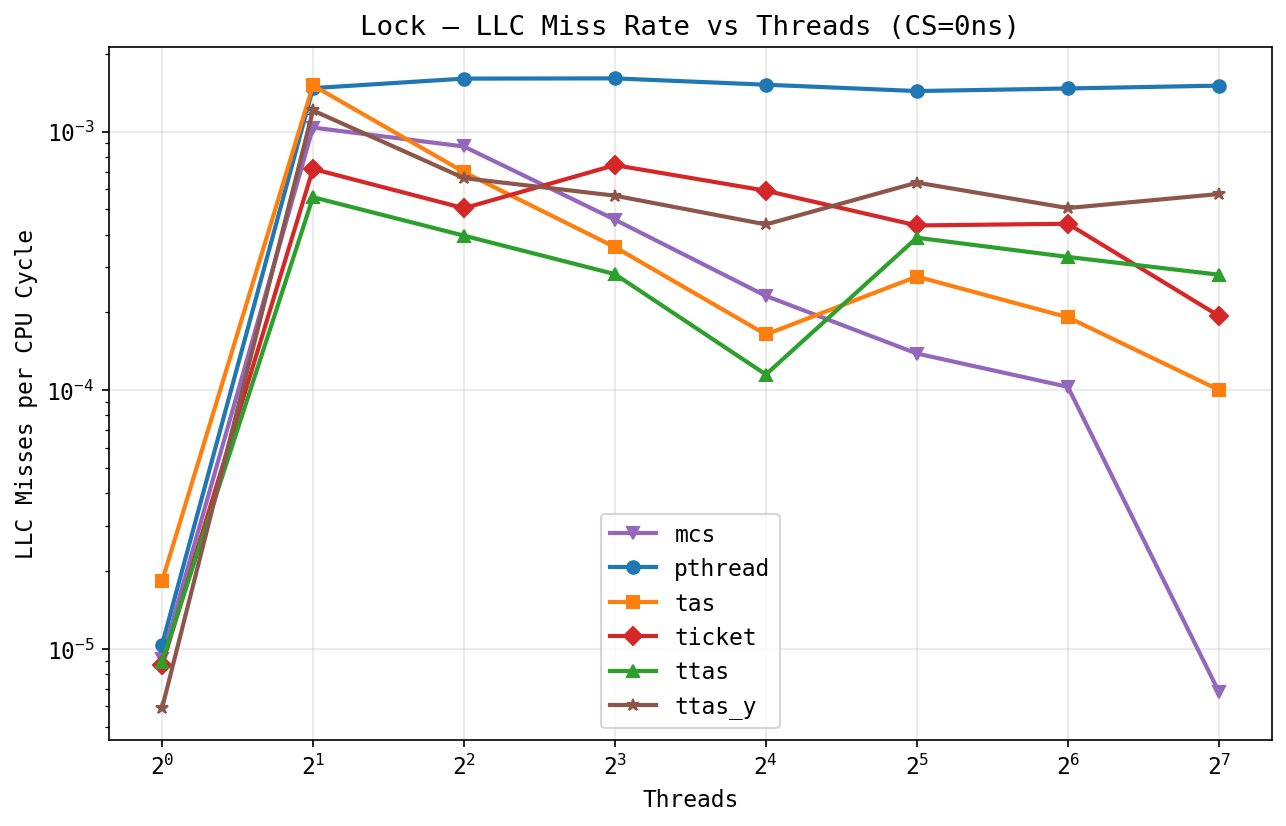
The GHC story scaled to 128 threads. Pthread: lowest cycles-per-acquire (sleeps), highest miss-rate-per-cycle (few active cycles, all near cold futex transitions). MCS / ticket: many cycles, all L1-resident spin. LLC misses are where the cross-socket traffic shows up: ticket and TAS ride the fabric hard at 128 threads; MCS stays low (private node memory); pthread near zero (sleeps). The per-cycle LLC rate is the cleanest read; rate of cross-socket traffic per unit CPU time.
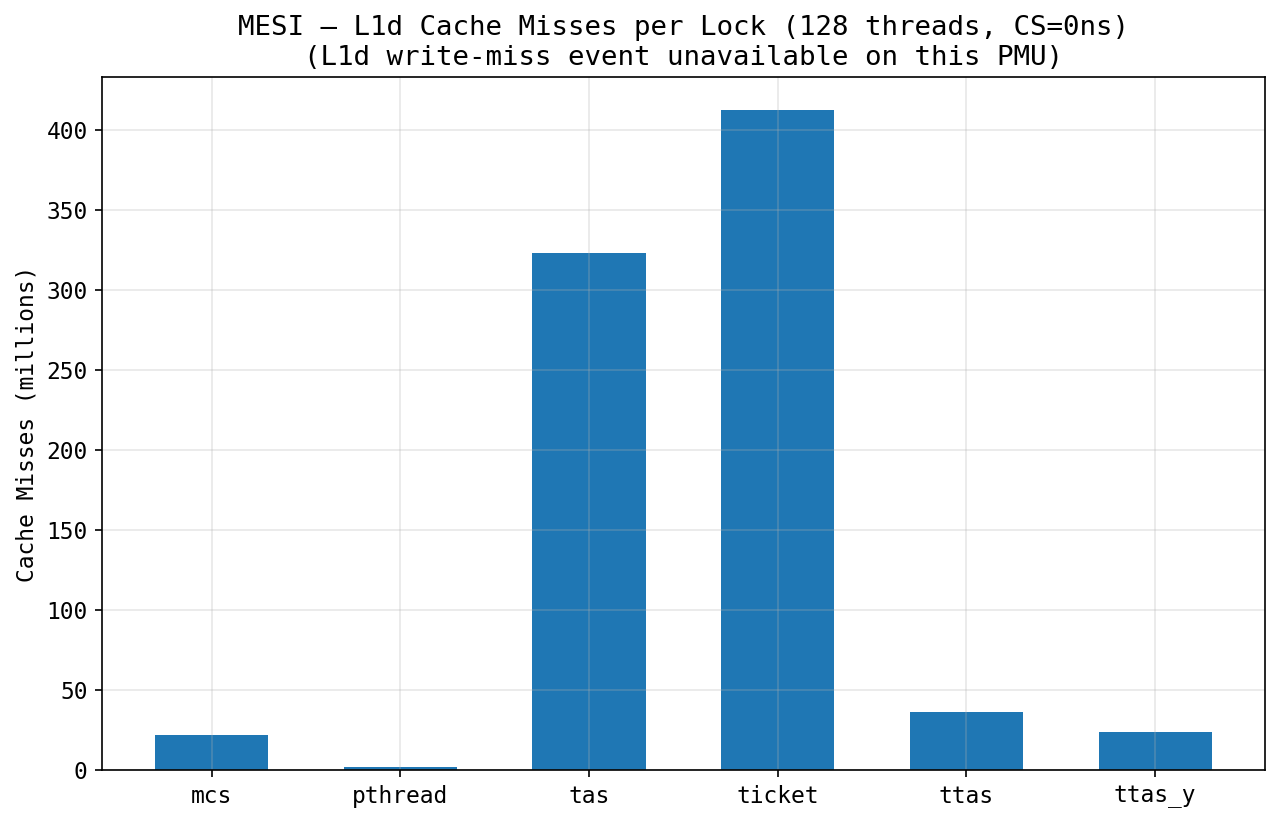
Total L1d misses at 128 threads. Ticket dominates at ~410 M, TAS at ~325 M, MCS at ~22 M, pthread at ~2 M. The 15× ratio between TAS/ticket and MCS is the fundamental MCS argument: spin on private nodes, write only the successor's line, and you generate proportionally less L1d traffic than the cache-line-bouncing spin variants.
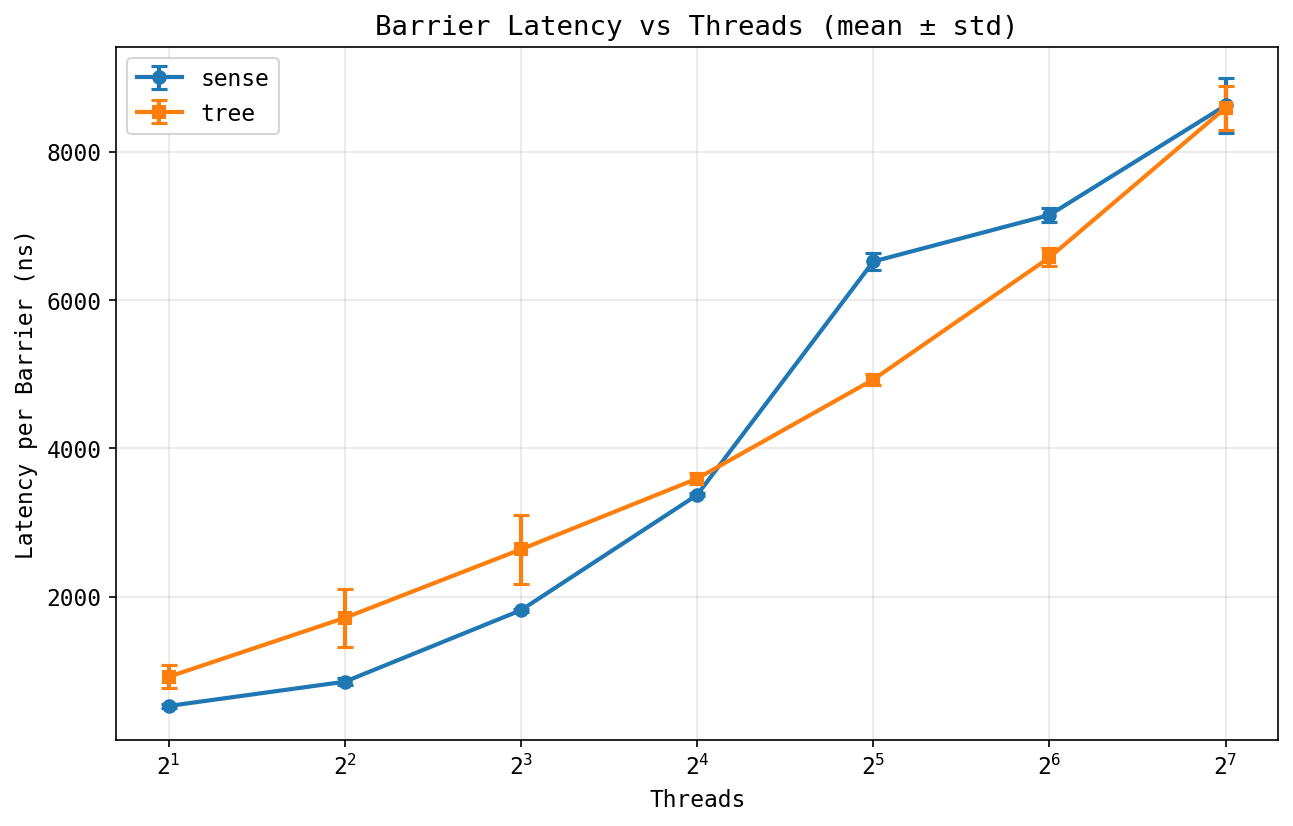
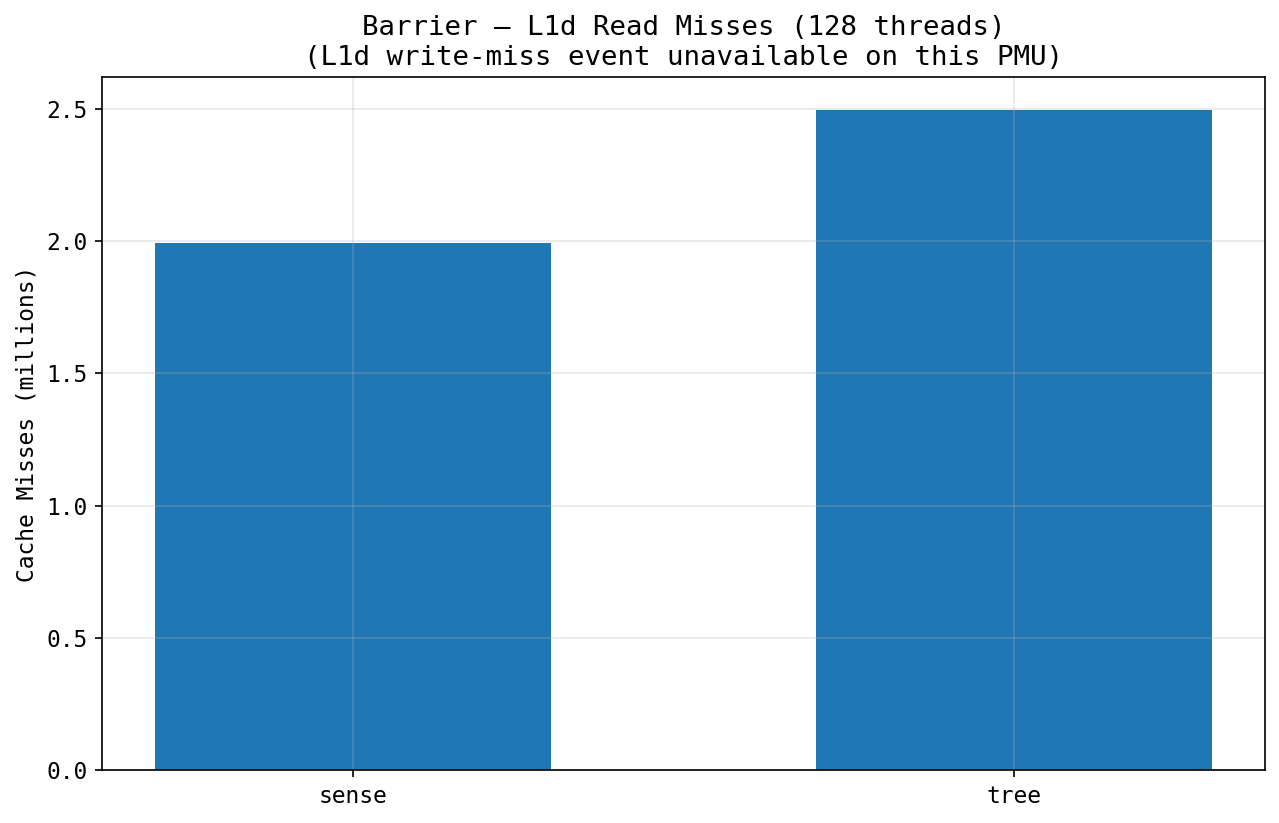
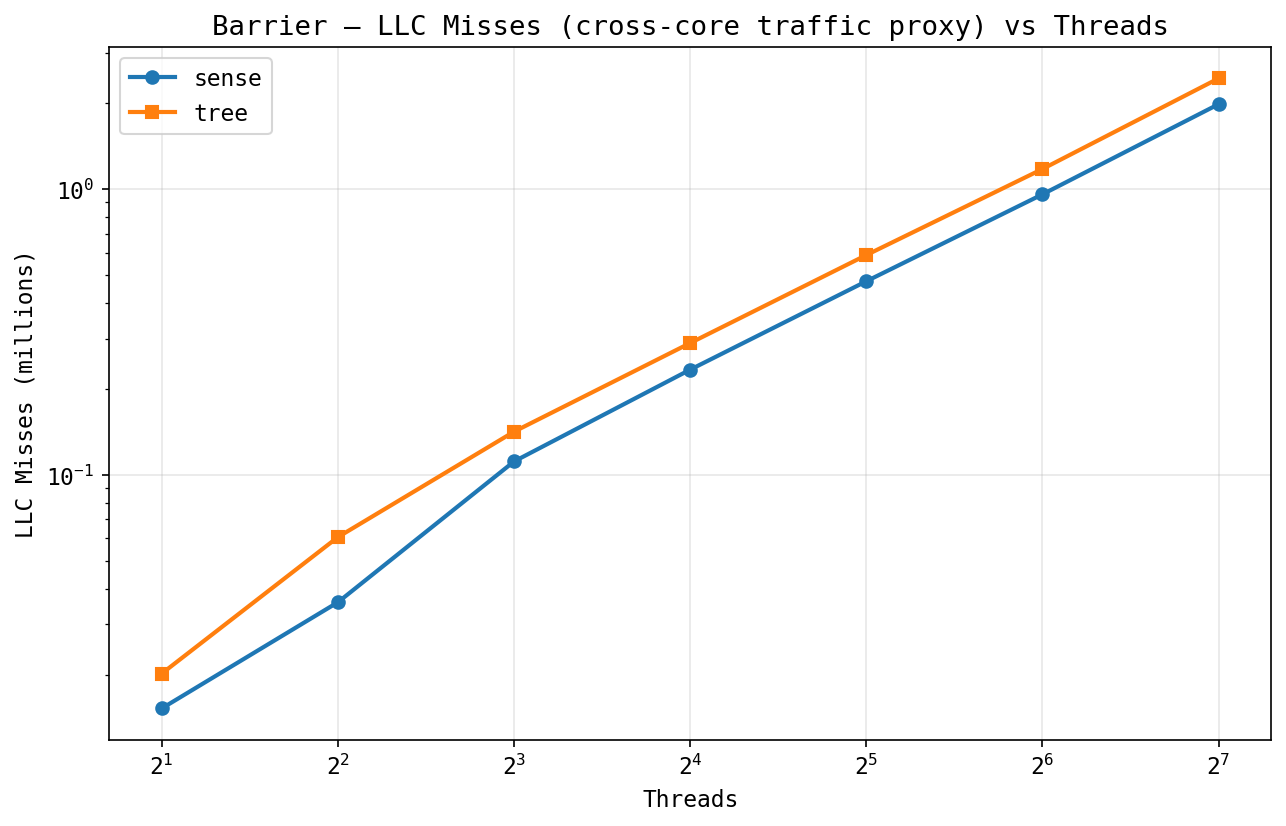
Barriers on PSC reach thousands of ns at 128 threads. Tree wins in the 16–64 thread range (its algorithmic sweet spot); they converge at 128 where the broadcast cost dominates either way. The MESI breakdown matches the lock pattern: sense's centralized counter generates many invalidations per event; tree's per-thread spin is mostly reads.
Two stories need both platforms: the lock ranking inverts between GHC and PSC, and the reduction crossover depends on P and the barrier implementation across the full thread range. "What limited the speedup" at the end folds in both sides.
GHC, 8 cores, short CS: pthread is not fastest. Pthread acquires are a libgcc call (~19 ns uncontended); spinlocks inline to one atomic (~8 ns). Spinlocks win until cache-line bouncing costs more than a futex roundtrip.
PSC, 128 cores: ranking flips. The PSC throughput plot has pthread at ~9 M ops/sec while ticket and MCS collapse to under 0.5 M; a ~30× gap. Coherence cost on 128 cores exceeds the futex roundtrip (~500 ns on AMD).
Conclusion: spinlocks for the small-machine, short-CS regime; pthread for large-machine, high-contention. FIFO spinlocks (ticket, MCS) lose anywhere preemption is possible. The textbook rule "spinlocks beat mutexes for short CS" needs the qualifier "on small machines."
reduction_combine_bench parameterizes the combine
op with W LCG iterations per call. Small W
models a cheap add; large W models an expensive
merge (sorted-list union, histogram, vector reduction). Three
variants:
pthread_barrier_t per stride.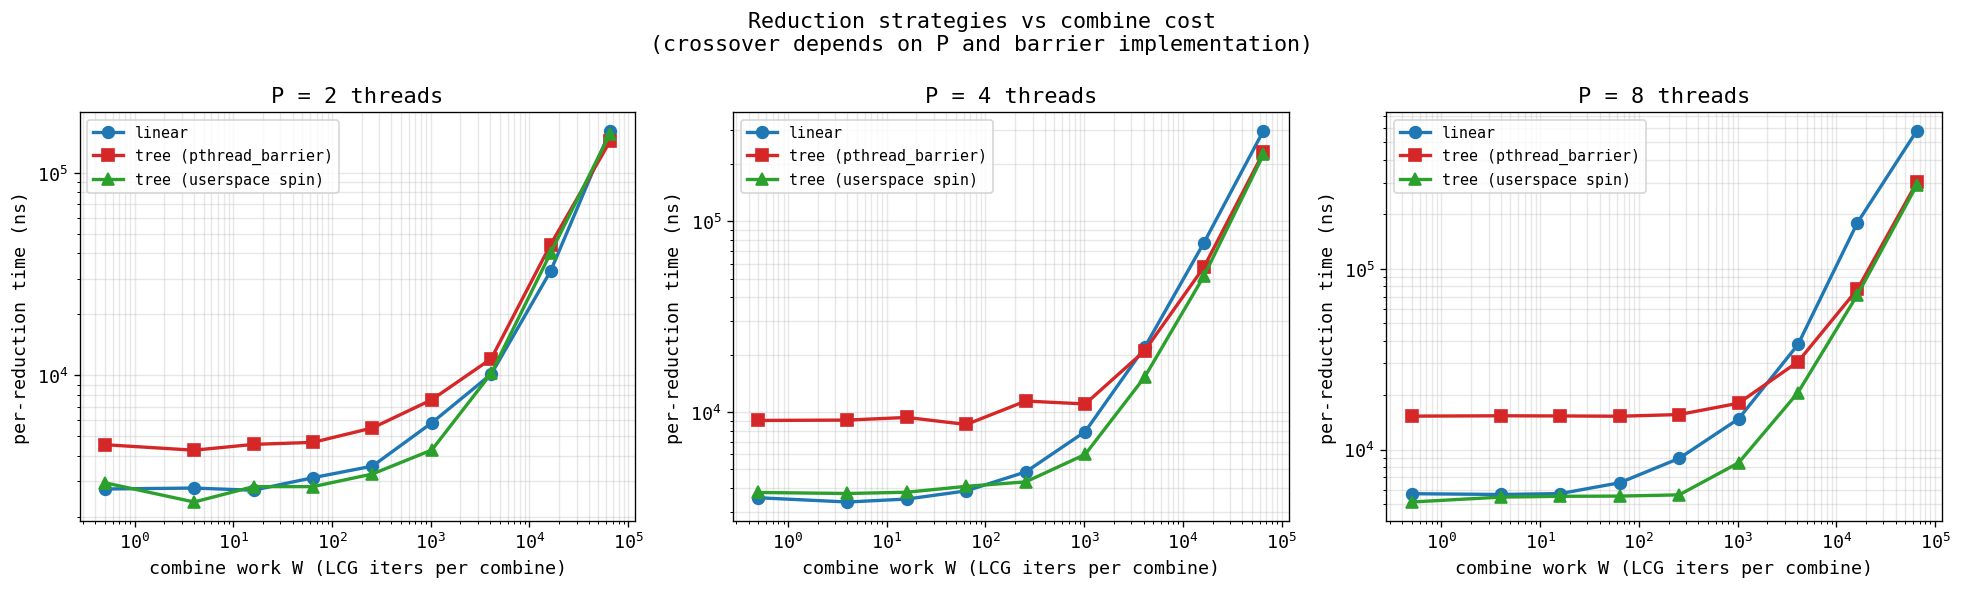
GHC (8 cores). Linear: flat at low W
(~1–5 µs, dominated by
ThreadPool::run overhead), grows as
P·W. Tree-userspace tracks linear at low
W, slope is log P·W, separates
as W grows. Tree-pthread is ~5× above
tree-userspace at low W; pure kernel barrier
overhead. At P=8: tree-userspace beats linear from
W ≈ 1000 (~1 µs combine);
tree-pthread only catches linear at W ≈ 65k.
At P=2 nothing beats linear (one barrier per combine,
overhead never amortizes).

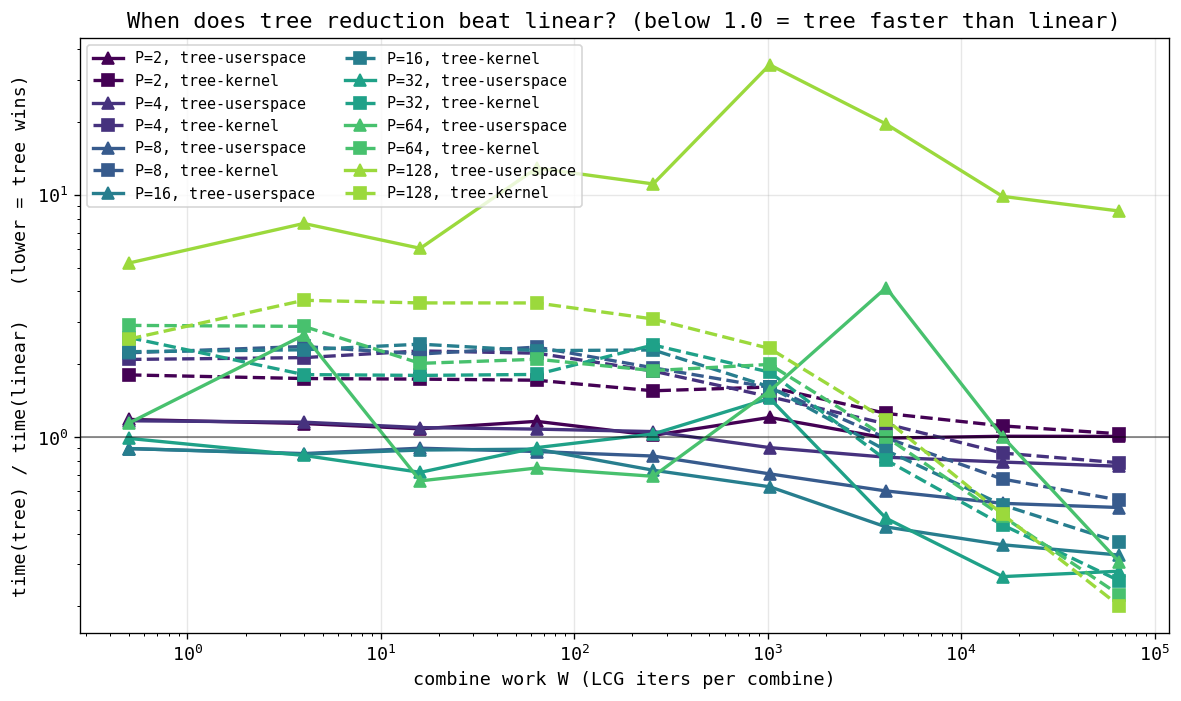
PSC (128 cores). The P vs log P gap opens up: at P=128, linear does 128 combines, tree does 7. The ratio plot shows tree-userspace dropping below 1.0 (= faster than linear) across more of the W range as P grows. Tree-pthread does the opposite ; kernel barrier cost balloons at 128 threads, so those dashed lines stay an order of magnitude above 1.0 even at W=65k. Implementation matters more than algorithm here.
Three takeaways:
pthread_barrier_t (kernel/futex) for
correctness reasons; userspace one-shot spin barriers
get the algorithmic win at the cost of breaking under
oversubscription.
Apps: synchronization overhead (Pi:
fetch_add on the dynamic counter), thread placement
(matmul mid-count dips), and OS migration noise (Mandelbrot,
hence the 6× pinning win). Sync primitives:
cache-coherence traffic (lock_throughput_cs0 inflection), futex
roundtrip cost (pthread loses on short CS), FIFO + preemption
stalls (ticket/MCS oversubscription cliff), and
combine-vs-barrier ratio (tree reduction only beats linear
when combine > barrier; see the crossover above). HW
counters confirm the cycle/cache breakdown each time.
CPU was the right substrate; the project is about sync-primitive tradeoffs and cache coherence. A GPU would have hidden the effects we wanted to measure: different memory model, no per-thread futex, no userspace locks.
The proposal listed a "hope-to-achieve" source-to-source
compiler that would translate #pragma omp
directives into omp0 API calls. We did not build this; it
was always a stretch goal and the runtime + analysis work
already filled the schedule. The implication is that omp0 is
a runtime library you call directly, not a drop-in
replacement for libgomp at the source level.
Both of us worked on essentially every part of the project together; design, implementation, debugging, runs, plots, and the writeup. We paired on most of the harder pieces (the AMD perf-counter rewrite, the ThreadPool race fix, the reduction barrier hunt). Splitting credit cleanly is artificial here: this was a genuinely shared effort, ~50/50.